
Logistic Regression R- Tutorial » Detailed Overview » finnstats. Logistic Regression R, In this tutorial we used the student application dataset for logistic regression analysis.
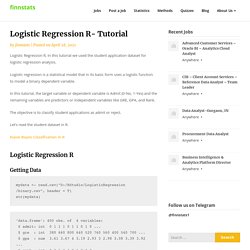
Logistic regression is a statistical model that in its basic form uses a logistic function to model a binary dependent variable. In this tutorial, the target variable or dependent variable is Admit (0-No, 1-Yes) and the remaining variables are predictors or independent variables like GRE, GPA, and Rank. The objective is to classify student applications as admit or reject. Let’s read the student dataset in R. Machine Learning with R: A Complete Guide to Logistic Regression - Appsilon. Logistic Regression with R Logistic regression is one of the most fundamental algorithms from statistics, commonly used in machine learning.
It’s not used to produce SOTA models but can serve as an excellent baseline for binary classification problems. Interested in machine learning for beginners? Check our detailed guide on Linear Regression with R. Today you’ll learn how to implement the logistic regression model in R and also improve your data cleaning, preparation, and feature engineering skills. Employee Attrition Analysis using Logistic Regression with R. Demystification of Logistic Regression - Analytics Vidhya. Logistic Regression - The Most Common Classification Algorithm in Python. AUC-ROC Curve in Machine Learning Clearly Explained - Analytics Vidhya. A Classification Technique. Logistic regression is one of the statistical techniques in machine learning used to form prediction models.

It is one of the most popular classification algorithms mostly used for binary classification problems (problems with two class values, however, some variants may deal with multiple classes as well). It's used for various research and industrial problems. Therefore, it is essential to have a good grasp on logistic regression algorithm. This tutorial is a sneak peek from many of Data Science Dojo’s hands-on exercises from their 5-day data science bootcamp, you will learn how logistic regression fits a dataset to make predictions, as well as when and why to use it. In short, Logistic Regression is used when the dependent variable(target) is categorical. To predict whether an email is spam (1) or not spam (0)Whether the tumor is malignant (1) or not (0)
How to Perform Ordinal Logistic Regression in R – R-posts.com. In this article, we discuss the basics of ordinal logistic regression and its implementation in R.
Ordinal logistic regression is a widely used classification method, with applications in variety of domains. This method is the go-to tool when there is a natural ordering in the dependent variable. For example, dependent variable with levels low, medium, high is a perfect context for application of logistic ordinal regression. Having wide range of applicability, ordinal logistic regression is considered as one of the most admired methods in the field of data analytics. Confidence intervals for GLMs. You've estimated a GLM or a related model (GLMM, GAM, etc.) for your latest paper and, like a good researcher, you want to visualise the model and show the uncertainty in it.

In general this is done using confidence intervals with typically 95% converage. If you remember a little bit of theory from your stats classes, you may recall that such an interval can be produced by adding to and subtracting from the fitted values 2 times their standard error. Unfortunately this only really works like this for a linear model. If I had a dollar (even a Canadian one) for every time I've seen someone present graphs of estimated abundance of some species where the confidence interval includes negative abundances, I'd be rich! Finalfit: Getting started. The finafit package brings together the day-to-day functions we use to generate final results tables and plots when modelling.
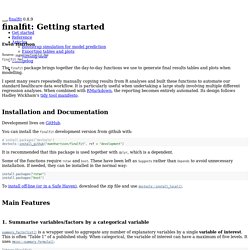
I spent many years repeatedly manually copying results from R analyses and built these functions to automate our standard healthcare data workflow. It is particularly useful when undertaking a large study involving multiple different regression analyses. When combined with RMarkdown, the reporting becomes entirely automated. Its design follows Hadley Wickham’s tidy tool manifesto. Installation and Documentation Development lives on GitHub. You can install the finalfit development version from github with: It is recommended that this package is used together with dplyr, which is a dependent. Some of the functions require rstan and boot. 5 Alternatives to the Default R Outputs for GLMs and Linear Models. How to build a logistic regression model from scratch in R - Open Source Automation. In a previous post, we showed how using vectorization in R can vastly speed up fuzzy matching.
Here, we will show you how to use R’s vectorization functionality to efficiently build a logistic regression model. Now we could just use the caret or stats packages to create a model, but building algorithms from scratch is a great way to develop a better understanding of how they work under the hood. An introduction to cutpointr ( ROC ) Cutpointr is an R package for tidy calculation of “optimal” cutpoints.
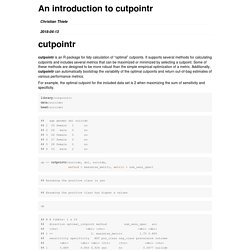
It supports several methods for calculating cutpoints and includes several metrics that can be maximized or minimized by selecting a cutpoint. Some of these methods are designed to be more robust than the simple empirical optimization of a metric. 30 Questions to test your understanding of Logistic Regression. ROC Curves in Two Lines of R Code. By Bob Horton, Microsoft Data Scientist ROC curves are commonly used to characterize the sensitivity/specificity tradeoffs for a binary classifier.
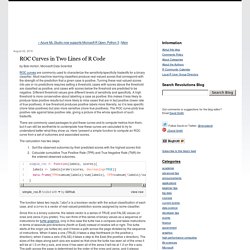
Most machine learning classifiers produce real-valued scores that correspond with the strength of the prediction that a given case is positive. Turning these real-valued scores into yes or no predictions requires setting a threshold; cases with scores above the threshold are classified as positive, and cases with scores below the threshold are predicted to be negative. Different threshold values give different levels of sensitivity and specificity. A high threshold is more conservative about labelling a case as positive; this makes it less likely to produce false positive results but more likely to miss cases that are in fact positive (lower rate of true positives). The calculation has two steps:
Logistic Regression Tutorial for Machine Learning. Logistic regression is one of the most popular machine learning algorithms for binary classification.
This is because it is a simple algorithm that performs very well on a wide range of problems. In this post you are going to discover the logistic regression algorithm for binary classification, step-by-step. After reading this post you will know: How to calculate the logistic function.How to learn the coefficients for a logistic regression model using stochastic gradient descent.How to make predictions using a logistic regression model. This post was written for developers and does not assume a background in statistics or probability. Logistic Regression for Machine Learning. Logistic regression is another technique borrowed by machine learning from the field of statistics. It is the go-to method for binary classification problems (problems with two class values). In this post you will discover the logistic regression algorithm for machine learning.
After reading this post you will know: The many names and terms used when describing logistic regression (like log odds and logit).The representation used for a logistic regression model.Techniques used to learn the coefficients of a logistic regression model from data.How to actually make predictions using a learned logistic regression model.Where to go for more information if you want to dig a little deeper. This post was written for developers interested in applied machine learning, specifically predictive modeling. Logistic Regression with R - Listen Data. #Read Data File mydata <- read.csv(" #Summary summary(mydata) #Cross Tab xtabs(~admit + rank, data = mydata) #Data Preparation.
How to use Multinomial and Ordinal Logistic Regression in R ? Introduction Most of us have limited knowledge of regression. Of which, linear and logistic regression are our favorite ones. As an interesting fact, regression has extended capabilities to deal with different types of variables. Do you know, regression has provisions for dealing with multi-level dependent variables too? I’m sure, you didn’t. For multi-level dependent variables, there are many machine learning algorithms which can do the job for you; such as naive bayes, decision tree, random forest etc. In this article, I’ve explained the method of using multinomial and ordinal regression. Prediction Intervals for Poisson Regression.
Different from the confidence interval that is to address the uncertainty related to the conditional mean, the prediction interval is to accommodate the additional uncertainty associated with prediction errors. As a result, the prediction interval is always wider than the confidence interval in a regression model. In the context of risk modeling, the prediction interval is often used to address the potential model risk due to aforementioned uncertainties. While calculating prediction interval of OLS regression based on the Gaussian distributional assumption is relatively straightforward with the off-shelf solution in R, it could be more complicated in a Generalized Linear Model, e.g. Poisson regression. InformationValue - r-statistics.co. The functions in InformationValue package are broadly divided in following categories: 1.
Diagnostics of predicted probability scores. Simple Guide to Logistic Regression in R. Introduction. Data Perspective: Introduction to Logistic Regression with R. In my previous blog I have explained about linear regression. How to perform a Logistic Regression in R. Logistic Regression in R – Part Two. Evaluating Logistic Regression Models in R. Logistic Regression Fundamentals « GormAnalysis.
Evaluating Logistic Regression Models. Logistic regression. Problem. Visualising theoretical distributions of GLMs. Two weeks ago I discussed various linear and generalised linear models in R using ice cream sales statistics. The data showed not surprisingly that more ice cream was sold at higher temperatures. icecream <- data.frame( temp=c(11.9, 14.2, 15.2, 16.4, 17.2, 18.1, 18.5, 19.4, 22.1, 22.6, 23.4, 25.1), units=c(185L, 215L, 332L, 325L, 408L, 421L, 406L, 412L, 522L, 445L, 544L, 614L) ) I used a linear model, a log-transformed linear model, a Poisson and Binomial generalised linear model to predict sales within and outside the range of data available.
I came to the conclusion that I preferred the binomial model for two reasons: the model simulates only whole numbers, just like the observational data and it has natural boundaries defined by zero sales and a market saturation level. Generalised Linear Models in R. Linear models are the bread and butter of statistics, but there is a lot more to it than taking a ruler and drawing a line through a couple of points. Some time ago Rasmus Bååth published an insightful blog article about how such models could be described from a distribution centric point of view, instead of the classic error terms convention. I think the distribution centric view makes generalised linear models (GLM) much easier to understand as well. That’s the purpose of this post. Using data on ice cream sales statistics I will set out to illustrate different models, starting with traditional linear least square regression, moving on to a linear model, a log-transformed linear model and then on to generalised linear models, namely a Poisson (log) GLM and Binomial (logistic) GLM.
Additionally, I will run a simulation with each model. Along the way I aim to reveal the intuition behind a GLM using Ramus’ distribution centric description. The data The challenge Linear least square Summary. More on Prediction From Log-Linear Regressions. Example 2014.7: Simulate logistic regression with an interaction.
Regression - Assumptions of generalised linear model. Some R Resources for GLMs. R Data Analysis Examples: Logit Regression. R - Generalized linear Models. Glm for predicting rates. » Poisson regression fitted by glm(), maximum likelihood, and MCMC. ROC curves and classification. Dave Giles' Blog: Forecasting From Log-Linear Regressions.
R Data Analysis Examples: Logit Regression. FAQ: How do I interpret odds ratios in logistic regression? R - Generalized linear Models. Logistic regression and categorical covariates.