
Index of /papers. Quick-R: Home Page. Seven forecasting blogs. Paul Murrell's Home Page. Www.csee.wvu.edu/~xinl/library/papers/math/statistics/Akaike1969.pdf. CRAN Task Views. D G Rossiter - Publications & Computer Programs. Rossiter, DG 2012.
Introduction to the R Project for Statistical Computing for use at ITC 14-Aug-2012, v + 136 pp. (First version 2003) On-line, version 4.0 (3 Mb) Rossiter, DG 2014. Tutorial: Using the R Environment for Statistical Computing: An example with the Mercer-Hall wheat yield dataset Version 2.9, 09-Jan-2013. iv+234 pp.
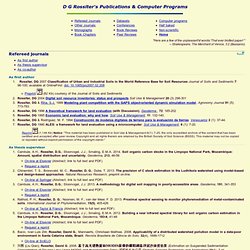
Self-published online. The R Project for Statistical Computing. Exploratory Data Analysis and Regression in R. Exploratory Data Analysis (EDA) and Regression This tutorial demonstrates some of the capabilities of R for exploring relationships among two (or more) quantitative variables.
Bivariate exploratory data analysis We begin by loading the Hipparcos dataset used in the descriptive statistics tutorial, found at Type hip <- read.table(" header=T,fill=T) names(hip) attach(hip) In the descriptive statistics tutorial, we considered boxplots, a one-dimensional plotting technique. Boxplot(Vmag~cut(B.V,breaks=(-1:6)/2), notch=T, varwidth=T, las=1, tcl=.5, xlab=expression("B minus V"), ylab=expression("V magnitude"), main="Can you find the red giants?
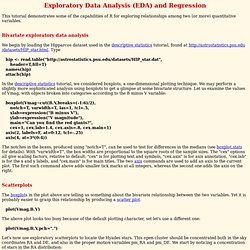
" The notches in the boxes, produced using "notch=T", can be used to test for differences in the medians (see boxplot.stats for details). Scatterplots The boxplots in the plot above are telling us something about the bivariate relationship between the two variables. Plot(Vmag,B.V) plot(Vmag,B.V,pch=". ") plot(RA,DE,pch=". ") rect(50,0,100,25,border=2) Principal Component Analysis. A simple example Consider 100 students with Physics and Statistics grades shown in the diagram below.
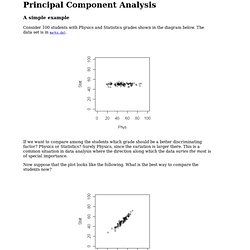
The data set is in marks.dat. If we want to compare among the students which grade should be a better discriminating factor? Physics or Statistics? Surely Physics, since the variation is larger there. Here the direction of maximum variation is like a slanted straight line. Dat = read.table("marks.dat",head=T) dim(dat) names(dat) pc = princomp(~Stat+Phys,dat) pc$loading Notice the somewhat non-intuitive syntax of the princomp function. CRAN: Contributed Documentation. Deepayan Sarkar - Homepage. Statistical Computing. The Comprehensive R Archive Network. Machine Learning Repository. Comprehensive R Archive. R Starter Kit. R Starter Kit This page is intended for people who: These materials have been collected from various places on our website and have been ordered so that you can, in step-by-step fashion, develop the skills needed to conduct common analyses in R.
Getting familiar with R Class notes: There is no point in waiting to take an introductory class on how to use R. Instead, we have notes of our introductory class that you can download and view. Retirement : simulating wealth with random returns, inflation and withdrawals. R Graph Gallery. Cost Estimating Predictive Modeling. Time Series Analysis. In the following topics, we will first review techniques used to identify patterns in time series data (such as smoothing and curve fitting techniques and autocorrelations), then we will introduce a general class of models that can be used to represent time series data and generate predictions (autoregressive and moving average models).

Finally, we will review some simple but commonly used modeling and forecasting techniques based on linear regression. For more information see the topics below. General Introduction In the following topics, we will review techniques that are useful for analyzing time series data, that is, sequences of measurements that follow non-random orders. Unlike the analyses of random samples of observations that are discussed in the context of most other statistics, the analysis of time series is based on the assumption that successive values in the data file represent consecutive measurements taken at equally spaced time intervals.
Two Main Goals. Introduction to Time Series Analysis. Applied Time Series Analysis. [Home] [Lectures] [Assignments] [Exams] Introduction Model-based forecasting methods; autoregressive and moving average models; ARIMA, ARMAX, ARCH, and state-space models; estimation, forecasting and model validation; missing data; irregularly spaced time series; parametric and nonparametric bootstrap methods for time series; multiresolution analysis of spatial and time-series signals; and time-varying models and wavelets.
[From: Course Description - Statistics Department, Rutgers University] Course Outline Part I: Basic Concept of Time Series Introduction, Regression Model vs. Resources to help you learn and use R. Home Page. R Programming. Welcome to the R programming Wikibook This book is designed to be a practical guide to the R programming language[1].
R is free software designed for statistical computing. There is already great documentation for the standard R packages on the Comprehensive R Archive Network (CRAN)[2] and many resources in specialized books, forums such as Stackoverflow[3] and personal blogs[4], but all of these resources are scattered and therefore difficult to find and to compare. The aim of this Wikibook is to be the place where anyone can share his or her knowledge and tricks on R. It is supposed to be organized by task but not by discipline[5]. How can you share your R experience ? Explain the syntax of a commandCompare the different ways of performing each task using R.Try to make unique examples based on fake data (ie simulated data sets).As with any Wikibook please feel free to make corrections, expand explanations, and make additions where necessary.
Bayesian Inference. Not So Standard Deviations. I came across this R package on GitHub, and it made me so excited that I decided to write a post about it.
It’s a compilation by Karl Broman of various R functions that he’s found helpful to write throughout the years. Wouldn’t it be great if incoming graduate students in Biostatistics/Statistics were taught to create a personal repository of functions like this? Not only is it a great way to learn how to write an R package, but it also encourages good coding techniques for newer students (since it encourages them to write separate functions with documentation). It also allows for easy reprodicibility and collaboration both within the school and with the broader community. Case in point — I wanted to use one of Karl’s functions (which I found via his blog… which I found via Twitter), and all I had to do was run: (Note that install_github is a function in the devtools package. Paul Murrell's Home Page.
Shiny.