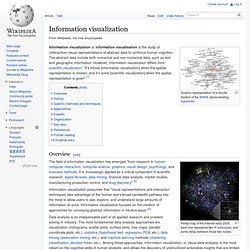
Visualization
< Data Warehouse
< foobar
Get flash to fully experience Pearltrees
Graphic representation of a minute fraction of the WWW , demonstrating hyperlinks Information visualization is the interdisciplinary study of "the visual representation of large-scale collections of non-numerical information, such as files and lines of code in software systems , library and bibliographic databases , networks of relations on the internet , and so forth". [ 1 ] Partial map of the Internet early 2005, each line represents two IP addresses , and some delay between those two, nodes.
FreeMind is a premier free mind-mapping software written in Java. The recent development has hopefully turned it into high productivity tool. We are proud that the operation and navigation of FreeMind is faster than that of MindManager because of one-click "fold / unfold" and "follow link" operations.
Dona Wong, whose graphics book I reviewed two years ago ( link ), has recently joined the New York Fed to lead an effort to visualize data. This is exciting because consumers are unlikely to learn anything from Excel spreadsheets, HTML tables, etc. which are the typical formats of public data. One of their efforts is visualization of mortgage delinquency data in the Tri-state and Long Island regions ( link ). This animation reminds me of the CDC obesity map, to which I gave a positive review in 2005 ( link ). This type of chart is great for revealing the evolution of a metric over time and over space.
Warning: Unknown: failed to open stream: Permission denied in Unknown on line 0 Fatal error: Unknown: Failed opening required '/Library/WebServer/Documents/Interface/infodesignpatterns/patterns.php' (include_path='.:') in Unknown on line 0
Computation and drawing of lines, axes, shadows even the grid itself is handled by pluggable "renderers". Not only are the plot elements customizable, plugins can expand functionality of the plot too! There are plenty of hooks into the core jqPlot code allowing for custom event handlers, creation of new plot types, adding canvases to the plot, and more!