
下载 - Pix4D. First Photo of U.S. by NASA Satellite : NASA. A giant photo map of the contiguous 48 states of the United States, the first ever assembled from satellite images, completed for NASA by the U.S.
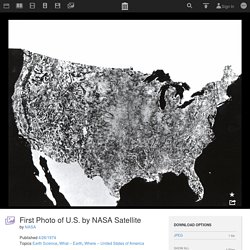
Department of Agriculture Soil Conservation Service Cartographic Division. The map is 10 by 16 feet, is composed of 595 cloud-free black-and-white images returned from NASA's first Earth Resources Technology Satellite (ERTS-1). The images were all taken at the same altitude (912 kilometers: 560 miles) and the same lighting angle. The images were produced by the spacecraft's Multi-spectral Scanner System (MSS) in Band 5, or the red portion of the visible spectrum, during the period July 25 to October 31, 1972. A similar mosaic has been made using Band 7, the near infrared, of the MSS. Where People Run in Major Cities. There are many exercise apps that allow you to keep track of your running, riding, and other activities.

Record speed, time, elevation, and location from your phone, and millions of people do this, me included. However, when we look at activity logs, whether they be our own, from our friends, or from a public timeline, the activities only appear individually. What about all together? Not only is it fun to see, but it can be useful to the data collectors to plan future workouts or even city planners who make sure citizens have proper bike lanes and running paths. Ever since I saw Nikita Barsukov map running traces in a handful of European cities, I wondered what the paths looked like for others. The maps below are what I got, mostly for American cities, but there are a few European cities in there too (alphabetical order).
Click to embiggen. Skybox Imaging - Welcome. Embed_map?title=true&description=true&search=true&shareable=true&cartodb_logo=true&layer_selector=false&legends=true&scrollwheel=true&fullscreen=true&sublayer_options=1. Would You Run Eight Miles To Get A Job? This Man Did, But There’s A Logical Reason Why. When David Miller applied for a job with Strava, a company that produces a fitness-tracking app, he wanted to stand out from the crowd.

He decided to submit his credentials along with some “Strava Art” that had a clear message about how he wanted the hiring process to end. The app’s GPS tracking produces a city map with the route taken after a run or bike ride. Miller planned, and ran, a route that spelled out the words “Hire Me” on San Francisco streets. The idea of “Strava Art” is not new. Spyglass on the Past: New York City 1836 and Today. 10 usos y 25 ejemplos de geomarketing para los negocios. ¿Sabes lo que es el geomarketing y los beneficios que te puede aportar si lo utilizas de forma estratégica en redes sociales?
NgEO. Great Open Source Map Tools for Web Developers. A long time ago, when Web 2.0 was just Web 1.0, we had to ask people for directions, copy them down, and hope we had a foldable map to help us find our way. Visor Web de Proyectos de Concentración Parcelaria. Los avances de la cartografía: hacia la tercera dimensión.
How to use QGis for great looking symbols in Cartaro. Since Cartaro does support the easy creation of user defined content types and OGC compliant services it is only logical to advance a step further and provide the ability for user defined styles as well.

Custom layer styles are therefore available now for rendering directly in the browser for WFS layers and on the server for WMS services. Both layer types are served by Cartaro with the help of OpenLayers and GeoServer. To get started a SLD 1.0 file is required. The file works for WFS and WMS layers but there is no need to use both layer types. The layers' styles are defined in the SLD file and allow to control the whole styling of the layer. Como añadir un mapa base con una imágen satélite a leaflet. La primera opción que se le ocurre a todo el mundo es añadir la capa de Google, aunque no esta del todo claro que para los chicos de Google sea legal que usemos sus imágenes en un mapa hecho con Leaflet , y no con la API de Google Maps.
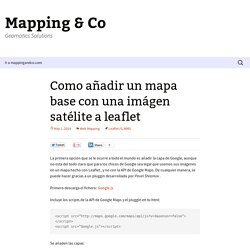
Como añadir un mapa base con una imágen satélite a leaflet. D-AIPX - Germanwings. Sistema de Información del Banco de Datos de la Naturaleza (BDN) Maps for the Web, made easy — CartoDB. Hindsight - Maps of Properties Through Time. CASA Working Paper 197. Visual Analytics for Urban Design Here we outline the rapid development of new tools for visualising cities and their functions with an emphasis on how they can be used in the analytical phases of urban design.
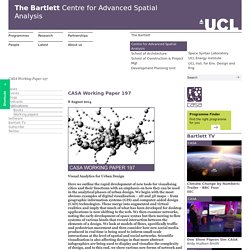
We begin with the most obvious examples of digital visualisation – 2D and 3D maps – from geographic information systems (GIS) and computer-aided design (CAD) technologies. These merge into augmented and virtual realities and imply that much of what has been developed for desktop applications is now shifting to the web. We then examine networks, noting the early development of space syntax but then moving to flow systems of various kinds that record interaction between the elements of a design. Sightsmap. Photos of the World. Mapstraction - Home. Mapstraction - Home. Mapping Out the GIS Software Landscape - GIS Geography. Last Updated: Aug 23, 2017 Which GIS software does the industry use?
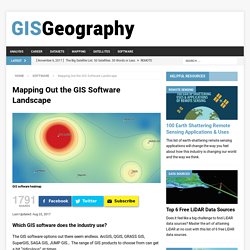
The GIS software options out there seem endless. ArcGIS, QGIS, GRASS GIS, SuperGIS, SAGA GIS, JUMP GIS… The range of GIS products to choose from can get a bit “ridiculous” at times. Your phone could help detect earthquakes. Smartphones could soon be used to detect earthquakes, bringing vital early warning systems to some of the world's poorest regions.
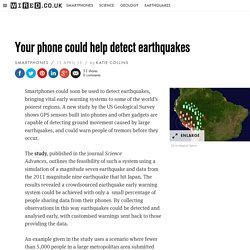
A new study by the US Geological Survey shows GPS sensors built into phones and other gadgets are capable of detecting ground movement caused by large earthquakes, and could warn people of tremors before they occur. The study, published in the journal Science Advances, outlines the feasibility of such a system using a simulation of a magnitude seven earthquake and data from the 2011 magnitude nine earthquake that hit Japan. Leaflet - a JavaScript library for mobile-friendly maps. Trulia Hindsight - Maps of Properties Through Time. OpenLayers 3 Examples. Advanced View Positioning example (center.html) This example demonstrates how a map's view can be adjusted so a geometry or coordinate is positioned at a specific pixel location.
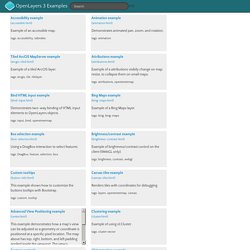
The map above has top, right, bottom, and left padding applied inside the viewport. A rum Lot of Maps - Maps and views blog. As is to be expected, King George III’s Topographical Collection contains outstanding examples of all the major maps and atlases published in his lifetime and extending back to 1660. Less comprehensively the collection goes back to include Italian maps published in Rome and Venice from 1540. Thomas Yeakell sr and William Gardner, View of the Town of Brightelmstone, (Brighton: P. Thomas, 1779). Maps K. Ushahidi. Map - Kloutspain. Leaflet - a JavaScript library for mobile-friendly maps. InfoIGME - Visor. Los avances de la cartografía: hacia la tercera dimensión. Cartografía temática. La cartografía temática forma parte de lo que se denomina generalmente la representación cartográfica. Permite la elaboración de imágenes gráficas particulares que traducen las relaciones espaciales de uno o varios fenómenos, de uno o varios temas.
La cartografía temática es un útil de análisis, de ayuda a la decisión y de comunicación ampliamente utilizado para representar una o varias variables. Ya se las defina como carta de inventario, de análisis, estática o dinámica, las cartas temáticas tienen todas puntos comunes. La carta temática es un documento gráfico basado en la comunicación de signos. Proviene del lenguaje visual. Referencias bibliográficas: M. Bertin J., La graphique et le traitement graphique de l’information, París, Flammarion, 1977, 250 p. R. M. Geolocalización - geomarketing - geoturismo.