
Visualization-python - Project Hosting on Google Code. Python for scientific use. Part I: Data Visualization LG #114. By Anders Andreasen Motivation and outline A first step towards qualitative understanding and interpretation of scientific data is visualization of the data.
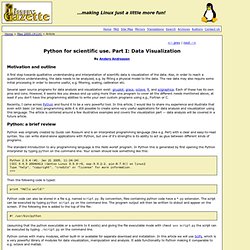
Also, in order to reach a quantitative understanding, the data needs to be analyzed, e.g. by fitting a physical model to the data. The raw data may also require some initial processing in order to become useful, e.g. filtering, scaling, calibration etc. Matplotlib: python plotting — Matplotlib v1.0.1 documentation. Examples. These are some simple examples showing the core functionality of the currently available pyvisi plotting objects. simplePlot This is a very simple example showing how one would produce a line plot using pyvisi.
It shows a graph of y = x^2.
Django. Python & semantic. Livres.