
LucidChart - Flow Chart Maker & Online Diagram Software. Free Online Organization Chart - EasyOrgChart.com. WorkFlowy - Organize your brain. Flowchart Symbols Defined: Business Process Map and Flow Chart Symbols and their Meanings. Flowchart Symbols and Their Meanings By Nicholas Hebb The following is a basic overview, with descriptions and meanings, of the most common flowchart symbols - also commonly called flowchart shapes, flow diagram symbols or process mapping symbols, depending upon what type of diagram you're creating.

The table below lists the flowchart symbol drawing, the name of the flowchart symbol in Microsoft Office (with aliases in parentheses), and a short description of where and how the flowchart symbol is used. Excel Flowchart Wizard FlowBreeze is a flowchart add-in for Microsoft Excel that makes creating flowcharts simple and pain free. Learn more » Download Process / Operation Symbols Branching and Control of Flow Symbols Input and Output Symbols File and Information Storage Symbols Data Processing Symbols The flowchart symbol names in parentheses are common alternates for a given shape.
The Most Commonly used Flowchart Symbols About the Flowchart Symbols. What do the Different Flowchart Shapes Mean? Object Management Group - UML. Visual Methods of Communicating Structure, Relationship, and Flow. By Mike Hughes Published: November 16, 2009 “Many of us are more comfortable communicating in words than in pictures.”
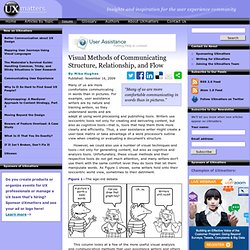
Many of us are more comfortable communicating in words than in pictures. For example, user assistance writers are by nature and training writers, so they understand words and are adept at using word processing and publishing tools. Writers use lexicentric tools not only for creating and delivering content, but also as cognitive tools—that is, tools that help them think more clearly and efficiently. However, we could also use a number of visual techniques and tools—not only for generating content, but also as cognitive and analysis tools. Figure 1—The age-old debate This column looks at a few of the more useful visual analysis and communication methods that user assistance writers and others can use to help them understand and communicate structure, relationship, and flow.
Block Diagrams Block diagrams show structure and relationships. Flowcharts Use Case Diagrams Mind Maps. Need to Document How Work Happens? Map The Process. Let's say you know which work area, or process, needs improvement.
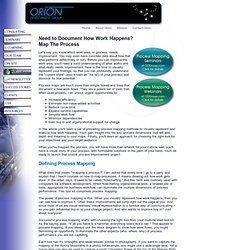
You may even have concrete data about how that area performs (effectively or not). Before you can improve the work area, you'll need a solid understanding of what works and what really needs improvement. Now is the time to visually represent your findings, so that you can profoundly understand the "current state" (also known as "As Is") of your process and discover its true potential. Process maps are much more than simple boxes and lines that document a how work flows.
They are a potent set of tools that, when used properly, can unlock urgent opportunities to: Increase efficiencyEliminate non-value-added activitiesReduce cycle timeExpand service capabilitiesSimplify work flowMinimize dependenciesGain buy-in and organizational support for change In this article you'll learn a set of prevailing process mapping methods to visually represent and analyze how work happens. Defining Process Mapping What's In The Toolkit?