
Fast and beautiful maps. Fast and beautiful maps. 50 JavaScript Libraries for Charts and Graphs. How are you visualizing data in JavaScript?
What is your favorite library for creating charts and graphs with JavaScript? I have been a long time fan of jqPlot for its open source approach, simplicity, examples, and great features. It performs well, it is used by many corporations, and it is built on top of jQuery. Recently, however, D3 has really caught my eye. It uses JavaScript, HTML, SVG and CSS to really bring data to life. Demos - JavaScript InfoVis Toolkit.
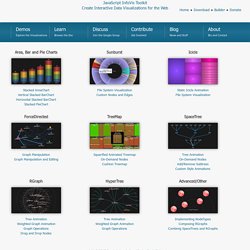
JavaScript InfoVis Toolkit Create Interactive Data Visualizations for the Web Home ● Download ● Builder ● Donate.
D3.js - Data-Driven Documents. JasperReports Library. JavaScript Charts for the Grown-Ups. Gnuplot homepage. Highcharts product. What is Highcharts?
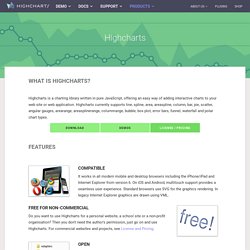
Highcharts is a charting library written in pure JavaScript, offering an easy way of adding interactive charts to your web site or web application. Highcharts currently supports line, spline, area, areaspline, column, bar, pie, scatter, angular gauges, arearange, areasplinerange, columnrange, bubble, box plot, error bars, funnel, waterfall and polar chart types.
jQuery Chart Plugin for FusionCharts Suite XT. FusionWidgets XT, from FusionCharts Suite XT, supports a variety of gauges that can be used to plot KPIs for dashboards and monitors.
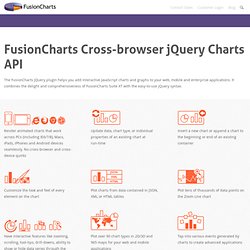
These gauges are real-time and can be configured to automatically poll servers every n seconds to request new data and update itself. To create a gauge, you use the same insertFusionCharts(), but provide a slightly different JSON data structure. Apart from the chart types shown above, using FusionCharts Suite XT, you can create over 90 chart types, including: