
The 16 Most Compelling Infographics Of 2012. 2012 might be the year which we reached "peak infographic.
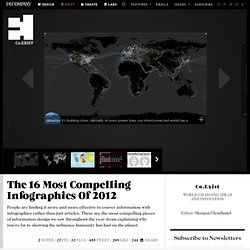
" You can’t have an issue or a piece of data without putting it into a picture so it’s easier for people to understand. While this has mostly resulted in a glut of ugly graphics that don’t actually do anything with data (and you’ll see some of these below), it’s still an incredibly simple way to get information to you fast. And this year, some of our most compelling content has appeared in the format. These are some of our favorites. You can see every infographic we’ve written about here. An always popular graphic trope is to find different ways of looking at the world map and how human beings are changing it; anything that visualized this new era--dubbed the Anthropocene--where humanity is the most powerful force on Earth, and we saw several brilliant versions of this.
And then, of course: bikes. 1: Our Massive Impact On Earth, In Glowing Maps 2: Crazy Maps Show The World Organized By Human Activity But it’s not your fault. Jam With Chrome - Nominee as Best Site of 2012. The Useless Web. Piktochart: simple infographic creator online for the busy professional. Rise of the visualizations Businesses of all sizes are taking advantage of the increasingly available web tools to better present information visually, be it at a company meeting or in presenting services and products to a client, and there is no shortage of infographics these days.
But because the trend for the past few years has been toward visualizing any information possible, you end up with infographics that are more like this: Even professionally designed infographics come out like the one above, or on the other extreme, professionals present data in the traditional, ugly form that is uninspiring, as below: You can do better The two images above are embarrassing for professionals as the information is convoluted or lost in a sea of bad design. Enter Picktochart.com, the infographic app that allows users to select a theme for their infographic, edit information and customize, then save to various formats. Alternative infographic makers. Venture Lab A Crash Course on Creativity: TOP 10 CREATIVITY VIDEOS.
Sign In Sign Inwith your Comcast account Sign in with your NovoEd password Forgot Password?

Or Sign in with Facebook Sign in with Google Sign in with O365 Don't have an account on NovoEd?
Инфографика по-русски. Big Orange Slide. SlideShare 3D - Beautiful Presentations in HTML & CSS. The SlideShare 3D tool transforms your presention slides into beautiful touch-enabled 3D slideshows written in pure HTML and CSS3.
The presentations will work on all modern browsers including Android or the mobile Safari on your iPad and iPhone. Running the presentation Desktop users may use the regular arrow keys or the mousewheel to move between slides. Press the Escape key to enter the slide overview mode. The transformed SlideShare deck is touch-enabled and thus you can use gestures like swipe or pinch to navigate through the slides on your touchscreen mobile phone or tablet. Behind the scenes Internally, the tool uses SlideShare's oEmbed endpoint to get the details of the requested presentation which are then transformed into a 3D slideshow using the reveal.js library.
Arms Trade. Attention required! Wolfram Alpha. Сервис письм от Ekvium. Nature. Design. Buy. Letters of Note. Ventes privées aux enchères. Tools. Bell Social Portrait. StreetSpark. Aakash Tablet Official Website. TBWA\SHANGHAI MOVING VIDEO. Music.