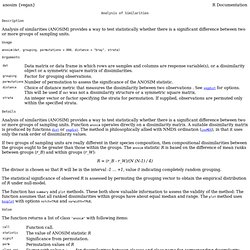

R: Analysis of Similarities. Description Analysis of similarities (ANOSIM) provides a way to test statistically whether there is a significant difference between two or more groups of sampling units.

Usage anosim(dat, grouping, permutations = 999, distance = "bray", strata) Arguments Details Analysis of similarities (ANOSIM) provides a way to test statistically whether there is a significant difference between two or more groups of sampling units. If two groups of sampling units are really different in their species composition, then compositional dissimilarities between the groups ought to be greater than those within the groups. R = (r_B - r_W)/(N (N-1) / 4) The divisor is chosen so that R will be in the interval -1 ... +1, value 0 indicating completely random grouping. The statistical significance of observed R is assessed by permuting the grouping vector to obtain the empirical distribution of R under null-model. The function has summary and plot methods. Value Note I don't quite trust this method. Revolutions. Workflows - Connect to twitter and analyze the key words (Shaily) [RapidMiner Workflow] Download Workflow Created at: 26/07/10 @ 04:12:58 Last updated: 26/07/10 @ 04:23:35 Version created on: 26/07/10 @ 04:12:58 by: Shaily Last edited on: 26/07/10 @ 04:23:35 by: Shaily Title: Connect to twitter and analyze the key words Type: RapidMiner Preview (Click on the image to get the full size) Download Scalable Diagram (SVG) Description Hi All, This workflow connects RapidMiner to Twitter and downloads the timeline.
![Workflows - Connect to twitter and analyze the key words (Shaily) [RapidMiner Workflow]](http://cdn.pearltrees.com/s/pic/th/myexperiment-rapidminer-35467612)
This workflow can be further modified to review various key events that have been talked about in the twitterland. Do let me know your feedback and feel free to ask me any questions that you may have. Web: Download Download Workflow Run Not available Workflow Components Original Uploader License All versions of this Workflow are licensed under: Credits (0) (People/Groups) None Attributions (0) (Workflows/Files) Shared with Groups (0) Featured In Packs (0) Log in to add to one of your Packs Ratings (0) Current: (0 ratings) Log in to rate and see breakdown of ratings. VisualData/Maps.
Cours Programmation R. R est à la fois un logiciel de statistique et un langage de programmation.

R est un logiciel de traitement statistique des données. Il fonctionne sous la forme d'un interpréteur de commandes. Il dispose d'une bibliothèque très large de fonctions statistiques, d'autant plus large qu'il est possible d'en intégrer de nouvelles par le système des "packages", des modules externes compilés (sous forme de DLL sous Windows) que l'on peut télécharger gratuitement sur internet. R propose également une palette étendue de fonctionnalités graphiques. Il est possible d'utiliser R en mode intercatif sans jamais avoir à programmer. R est un langage de programmation (de script) interprété dérivé de S (disponible dans le logiciel S-PLUS).
Au fil des années, R sera de plus en plus incontournable dans le traitement exploratoire et statistique des données. Cet enseignement est avant tout un cours de programmation. Ce cours est dispensé en M2 Statistique et Informatique (SISE).