
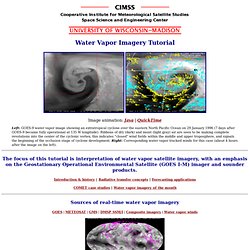
TM2003_030626. CIMSS Water Vapor Imagery Tutorial. Sources of real-time water vapor imagery GOES | METEOSAT | GMS | DMSP SSM/I | Composite imagery | Water vapor winds.
CIMSS Water Vapor Imagery Tutorial. What is an eddy? Can you spot the eddies?
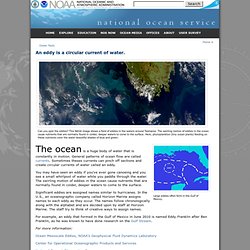
This NASA image shows a field of eddies in the waters around Tasmania. The swirling motion of eddies in the ocean cause nutrients that are normally found in colder, deeper waters to come to the surface. Here, phytoplankton (tiny ocean plants) feeding on these nutrients color the water beautiful shades of blue and green. What are eddies. The ocean is a huge body of water that is constantly in motion.
General patterns of ocean flow are called currents. Many geographic globes and world maps show general patterns of currents at the ocean surface. They are given names like the Gulf Stream, which flows northward off the east coast of the United States, or the Eastern Australian Current (EAC), which flows to the south along eastern Australia (Remember Finding Nemo?).
Www.atmos.illinois.edu/~snesbitt/ATMS505/stuff/05_Airmasses and Fronts.pdf. Montgomery Research Group - Home Page. Www.met.nps.edu/~mtmontgo/MR3252/MajdaStechmann2009sep29_newsletter.pdf. Www.met.nps.edu/~mtmontgo/MR3252/TM2003_030626.pdf. Probability Forecasting. 1.
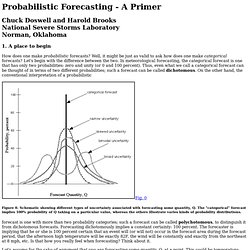
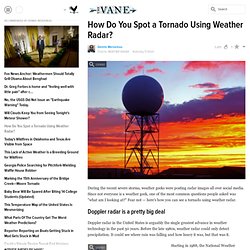
A place to begin How does one make probabilistic forecasts? Well, it might be just as valid to ask how does one make categorical forecasts? How Do You Spot a Tornado Using Weather Radar? I could swear you had a very similar article a few weeks ago in which you presented much the same information, before the recent tornadoes.
Did I just dream it? It's still good info, but I feel some déjà vu. WEATHER PREDICTION EDUCATION. Introduction to Rossby waves. Two words of introductionRossby waves, also known as planetary waves as they owe their origin to the shape and rotation of the earth, are one of the most intriguing natural phenomena.
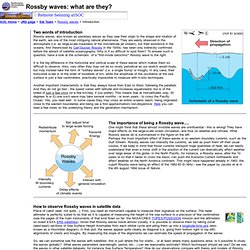
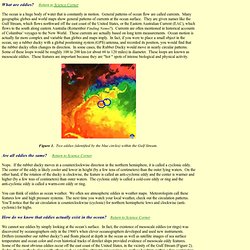
They are easily observed in the atmosphere (i.e. as large-scale meanders of the mid-latitude jet stream), but their existence in the oceans, first theoricised by Carl-Gustav Rossby in the 1930s, has been only indirectly confirmed before the advent of satellite oceanography. Why is it so difficult to spot them? To answer such a question, have a look at the schematic of a "first-mode baroclinic" Rossby wave to the right. El Niño Southern Oscillation (ENSO) From December 1997, this image shows the change of sea surface temperature from normal.
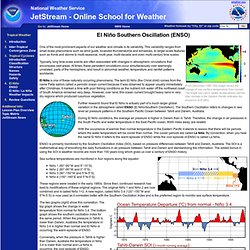
The bright red colors (water temperatures warmer than normal) in the Eastern Pacific indicates the presence of El Niño. One of the most prominent aspects of our weather and climate is its variability. This variability ranges from small-scale phenomena such as wind gusts, localized thunderstorms and tornadoes, to larger-scale features such as fronts and storms to multi-seasonal, multi-year, multi-decade and even multi-century time scales. Typically, long time-scale events are often associated with changes in atmospheric circulations that encompass vast areas. At times, these persistent circulations occur simultaneously over seemingly unrelated, parts of the hemisphere, and result in abnormal weather, temperature and rainfall patterns worldwide. Ocean Prediction Center. Introduction to Tropical Meteorology, Ch. 3: Global Circulation.
Introduction to Tropical Meteorology, Ch. 3: Global Circulation: 3.0 Overview. Introduction to Tropical Meteorology. Understanding Weather Charts - MetLink UK Weather and Climate Resources for Teachers, Schools and Students. By the end of the lesson, you will be able to: Understand isobars and their relationship with wind speed Identify various pressure systems and fronts on a weather chart Interpret and produce plotted weather symbols.
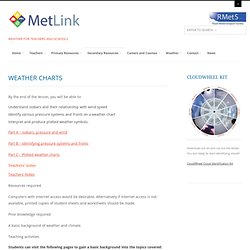
Part A – Isobars, pressure and wind Part B – Identifying pressure systems and fronts Part C – Plotted weather charts Teachers’ notes Teachers’ Notes Resources required Computers with Internet access would be desirable. Prior knowledge required A basic background of weather and climate. Teaching activities Students can visit the following pages to gain a basic background into the topics covered: Weather charts Interpreting Weather Maps The information on the student sheets can be delivered by the teacher and activities completed individually. Exercises Three worksheets with exercises are provided to consolidate learning. A series of additional exercises are provided for more able students, or those who have already studied pressure systems and fronts in more detail prior to this lesson.
How weather works. Prediction and uncertainty of Hurricane Sandy (2012) explored through a real-time cloud-permitting ensemble analysis and forecast system assimilating airborne Doppler radar observations - Munsell - 2014 - Journal of Advances in Modeling Earth Systems. How is snow formed? Snow is formed when temperatures are low and there is moisture - in the form of tiny ice crystals - in the atmosphere.
When these tiny ice crystals collide they stick together in clouds to become snowflakes. If enough ice crystals stick together, they'll become heavy enough to fall to the ground. How cold does it have to be to snow? Precipitation falls as snow when the air temperature is below 2 °C. It is a myth that it needs to be below zero to snow.
If the temperature is warmer than 2 °C then the snowflake will melt and fall as sleet rather than snow, and if it's warmer still, it will be rain. 'Wet' snow vs. The size and make up of a snowflake depends on how many ice crystals group together and this will be determined by air temperatures. When the temperature is slightly warmer than 0 °C, the snowflakes will melt around the edges and stick together to become big, heavy flakes. Snowflakes. A Forecaster's Overview of the Northwest Pacific. Radar Signatures for Severe Convective Weather.