
Physical Oceanography Division - NOAA/AOML TCHP. Sea surface temperature (SST) provides a measure of the surface ocean conditions, however no information about the subsurface ocean thermal structure (approximately the upper 50 m of the ocean) can be derived from SST alone.
For instance, it is known that the oceanic skin temperature erodes when the sea surface is affected by strong winds, creating a well-mixed layer that can reach depths of several tens of meters. Moreover, warm ocean features, mainly anticyclonic rings and eddies, are characterized by a deepening of the isotherms towards their centers with a markedly different temperature and salinity structure than the surrounding waters.
Several studies have shown that observations of sea surface height (SSH) are strongly correlated with the thermal structure of the upper ocean (e.g. Goni et al. 1996; Gilson et al. 1998; Mayer et al. 2001; Willis et al. 2004). The sea height anomaly (SHA) represents the deviation of the sea height with respect to its mean. Sea Temperature Water Temperatures. Sea Surface Temperature - IMCS Coastal Ocean Observation Lab. CCAR Ocean Data Viewers. Cdas-sflux_sst_atl_1.png (1024×715) Monthly Sea Surface Temperature Anomaly. This map displays monthly sea surface temperature anomalies for the globe.
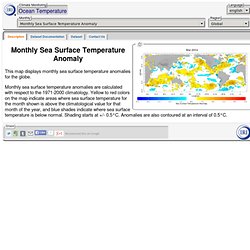
Monthly sea surface temperature anomalies are calculated with respect to the 1971-2000 climatology. Yellow to red colors on the map indicate areas where sea surface temperature for the month shown is above the climatological value for that month of the year, and blue shades indicate where sea surface temperature is below normal. Shading starts at +/- 0.5°C. Anomalies are also contoured at an interval of 0.5°C. Global Sea Surface Temperature Data Sets / TCC. We provide 1x1 degree resolution GPV datas from January 1891 up to the latest month.
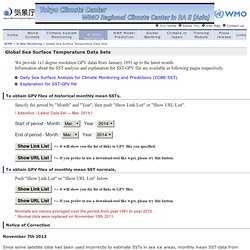
Information about the SST analysis and explanation for SST-GPV file are available in following pages respectively. Specify the period by "Month" and "Year", then push "Show Link List" or "Show URL List". ! Attention : Latest Data Set --- Mar. 2014 ! NRL 7320: Ocean Dynamics and Prediction Branch - Projects. NRL 7320: Ocean Dynamics and Prediction Branch. HYCOM mean 1/12 degree page. This is an official U.S.
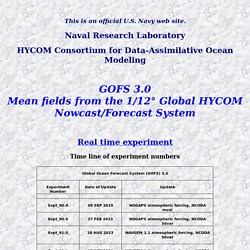
Navy web site. GOFS 3.0 Mean fields from the 1/12° Global HYCOM Nowcast/Forecast System Time line of experiment numbers Click on the ocean of interest to see regional mean plots. HYCOM 1/12 degree page. Global HYCOM 1/12 degree page. This is an official U.S.
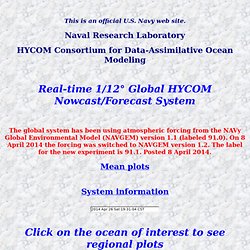
Navy web site. Real-time 1/12° Global HYCOM Nowcast/Forecast System The global system has been using atmospheric forcing from the NAVy Global Environmental Model (NAVGEM) version 1.1 (labeled 91.0). On 8 April 2014 the forcing was switched to NAVGEM version 1.2. The label for the new experiment is 91.1. Click on the ocean of interest to see regional plots Atlantic Ocean Indian Ocean Pacific Ocean Polar Oceans Global Comparison with in situ data Disclaimer: NRL is providing the INFORMATION on an "as is" basis. HYCOM 1/12 degree page.
Gulf SST. SST Carribean. SST Florida. Navy SST Image. Latest_cmoll.gif (640×480) Sea Surface Temperatures. E-PAC SST. Atlantic SST. Physical Oceanography Division - NOAA/AOML TCHP. GDAC Home Page. Sea Surface Temperature Images - Office of Satellite and Product Operations. Gulf of Mexico MODIS SST Viewer. Colorado Center for Astrodynamics Research The MODIS Aqua Sea Surface Temperature (SST) data was obtained from the Ocean Color Web hosted by NASA Goddard Space Flight Center.
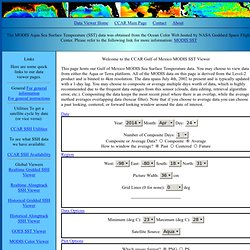
Please refer to the following link for more information: MODIS SST Links Here are some quick links to our data viewer pages. General For general information For general instructions Utilities To get a satellite cycle by date (or vice versa): CCAR SSH Utilities To see what SSH data we have available: CCAR SSH Availability Global Viewers Realtime Gridded SSH Viewer Realtime Alongtrack SSH Viewer Historical Gridded SSH Viewer Historical Alongtrack SSH Viewer GOES SST Viewer MODIS Color Viewer MODIS SST Viewer Gulf of Mexico Viewers.
Sea Surface Temperature (SST) Contour Charts - Office of Satellite and Product Operations. Current Operational SST Anomaly Charts - Office of Satellite and Product Operations.