
International Research Institute for Climate and Society. This site provides details of the current forecast status of ENSO conditions, as well as background information on both the physical phenomenon and some of its associated impacts.
For more information, check out #IRIforecast on Twitter, or ask us a question using #ENSOQandA. A summary of each month’s forecast briefing will be posted on the third Friday of each month. Click Here for the Current Forecast. Research Global Climate Division ENSO and seasonal forecasts. EL Niño / La Niña Updates. International Research Institute for Climate and Society. Web-Based Interactive Ocean Modeling. History of El Niño. El Niño Modoki Phenomenon in the Tropical Pacific. Research Global Climate Division ENSO and seasonal forecasts.
Pacific Region Panel. 1.To oversee and facilitate the implementation of CLIVAR in the Pacific sector in order to meet the objectives outlined in the Science and Implementation Plans in collaboration with other relevant panels, research foci groups and task teams.
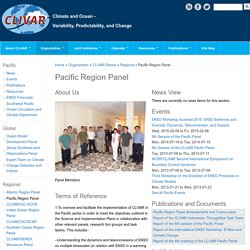
This includes : –Understanding the dynamics and teleconnexions of ENSO on multiple timescales (in relation with ENSO in a warming world RF) –Indo-Pacific Decadal Variability and its global connexion (in relation with Climate Dynamics Panel) –Ocean mass and property transports and their relationships to the Pacific climate and other basins (in relation with other basin panels) – Regional impacts of climate variability and changes (sea level, ecosystems, extreme events, etc) (in relation with regional sea level RF and upwelling RF) International Research Institute for Climate and Society. El Niño: Is 2014 the new 1997? El Niño: Is 2014 the new 1997?
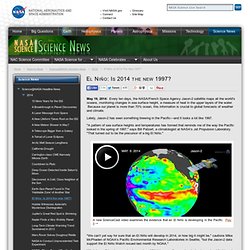
May 19, 2014: Every ten days, the NASA/French Space Agency Jason-2 satellite maps all the world's oceans, monitoring changes in sea surface height, a measure of heat in the upper layers of the water. Because our planet is more than 70% ocean, this information is crucial to global forecasts of weather and climate. Lately, Jason-2 has seen something brewing in the Pacific—and it looks a lot like 1997. El Niño – riding the climate roller coaster - Academy of Science. The Australian Bureau of Meteorology site has a vast amount of information about climate.

Here is just a taste: PMEL/TAO: The El Niño story. Among these consequences are increased rainfall across the southern tier of the US and in Peru, which has caused destructive flooding, and drought in the West Pacific, sometimes associated with devastating brush fires in Australia.
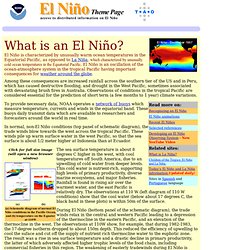
Observations of conditions in the tropical Pacific are considered essential for the prediction of short term (a few months to 1 year) climate variations. To provide necessary data, NOAA operates a network of buoys which measure temperature, currents and winds in the equatorial band. Variability: Oceanic Niño Index. The El Niño - Southern Oscillation (ENSO) is a recurring climate pattern involving changes in the temperature of waters in the central and eastern tropical Pacific Ocean.
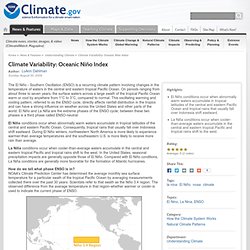
On periods ranging from about three to seven years, the surface waters across a large swath of the tropical Pacific Ocean warm or cool by anywhere from 1°C to 3°C, compared to normal. Slow slosh of warm water across Pacific hints El Niño is brewing. The El Niño / La Niña climate pattern that alternately warms and cools the eastern tropical Pacific is the 800-pound gorilla of Earth’s climate system.
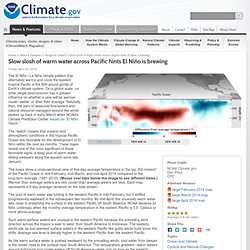
On a global scale, no other single phenomenon has a greater influence on whether a year will be warmer, cooler, wetter, or drier than average. SVS Animation 287 - Visualizing El Niño. Visualizing El Nino From NASA Scientific Visualization Studio. News Online (Story 2225) May 17, 2004 — NOAA forecasters are predicting an above-normal Atlantic hurricane season.
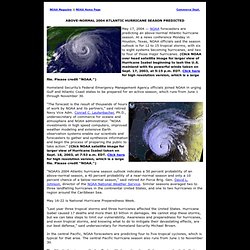
At a news conference Monday in Houston, Texas, NOAA officials said the season outlook is for 12 to 15 tropical storms, with six to eight systems becoming hurricanes, and two to four of those major hurricanes. (Click NOAA over head satellite image for larger view of Hurricane Isabel beginning to lash the U.S. mainland with its powerful winds taken on Sept. 17, 2003, at 5:15 p.m. EDT. Click here for high resolution version, which is a large file. Please credit “NOAA.”) Homeland Security’s Federal Emergency Management Agency officials joined NOAA in urging Gulf and Atlantic Coast states to be prepared for an active season, which runs from June 1 through November 30.
UCAR - University Corporation for Atmospheric Research. May 14, 2014 | Researchers and forecasters have long known that El Niño can influence weather thousands of miles away.
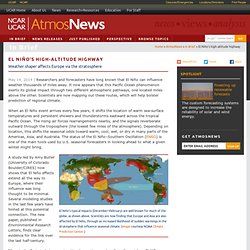
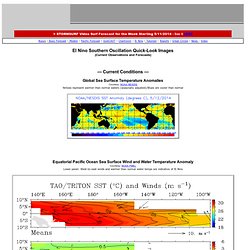
It now appears that this Pacific Ocean phenomenon exerts its global impact through two different atmospheric pathways, one located miles above the other. Scientists are now mapping out these routes, which will help bolster prediction of regional climate. Powertools ENSO Quick-Look. El Nino Southern Oscillation Quick-Look Images(Current Observations and Forecasts) --- Current Conditions ---
Moderate to strong El Nino becoming increasingly likely - New York Metro Weather. While our area has been enjoying a stretch of pleasant and warmer weather, many meteorologists and weather hobbyists alike have been analyzing interesting data in the Equatorial Pacific: signs of a developing El Nino. An El Nino is generally defined as a trimonthly period where waters in the Equatorial Pacific — from 160 Degrees East to 80 Degrees West Longitude — are warmer than normal. This tends to have effects on the general atmospheric circulation, which will be detailed in this article. World is unprepared for major El Niño later this year - environment - 07 May 2014. Wild weather is coming in 2014, with floods, storms and droughts expected around the Pacific, but little is being done to protect the people on the front line THE weather is preparing to go wild, and will wreak havoc and death around the globe later this year.
Storm Prediction Center - ENSO Strength and Tornadoes. The charts below illustrate that occasional weak cool-season links may occur between the phase strength of the El Niño Southern Oscillation (ENSO phase strength) and EF1 to EF5 tornado reports for bi-monthly periods from 1950 through 2010 (1951 to 2011 for the last pair, Dec-Jan period).
The charts display a simple running sum of EF1 to EF5 tornado events over the same bi-monthly periods that are used for the Multi-variate ENSO Index, or MEI, (Wolter, K., and M. S. Timlin, 1998). IRI Map Room. Monthly Sea Surface Temperature Anomaly. This map displays monthly sea surface temperature anomalies for the globe. Monthly sea surface temperature anomalies are calculated with respect to the 1971-2000 climatology. Yellow to red colors on the map indicate areas where sea surface temperature for the month shown is above the climatological value for that month of the year, and blue shades indicate where sea surface temperature is below normal. Shading starts at +/- 0.5°C. Anomalies are also contoured at an interval of 0.5°C.
El Niño and La Niña or ENSO / ENSO - our-planete.info. El Niño and La Niña Years and Intensities. Trans-Niño years could foster tornado outbreaks. In 2011, more than 1,600 confirmed tornadoes touched down in the United States. The twisters killed more than 550 people, injured more than 5,400, and resulted in economic damage that soared into the billions.
By mid-July 2013, close to 500 confirmed tornadoes had already touched down, killing 44 people, half during the single storm that hit Moore, Okla., on May 20. Although individual tornadoes can’t be predicted, new research from a team of scientists at NOAA’s Atlantic Oceanographic and Meteorological Laboratory in Miami, Fla., suggests that severe tornado outbreaks may be linked to specific weather patterns. Tornado outbreaks often form when warm, moist air from the Gulf of Mexico collides with cold fronts moving down through Canada.
The meeting of the two fronts causes convective instability as the warm air is pushed upward into colder layers, leading to cloud formation. Of the 10 most active years, seven occurred when the TNI was in a strongly positive phase, Lee says.
Japan ENSO. US Agencys ~ENSO INFO. Latest WMO ENSO Update. Download pdf versions: English Français Español. The El Niño Phenomenon: From Understanding to Predicting. University Papers. Weather ElNino Resources Info. Just two decades ago, it was a phenomenon known mostly by Peruvian fishermen and climatologists, today it has become a household word. Though undeserving of all the blame it gets for virtually every incident of unexpected and severe weather we receive, it does have a major impact on our weather and seasons, no matter where we live in the world. Origins—Ground Zero. Origins—Ground Zeroby Mark Hoover What is El Niño?
In a narrow sense, it's a giant puddle of heated water that sloshes across the Pacific Ocean. From NASA satellites, we can see the big picture; a massive pool of warm seawater, half again as large as the United States, builds in the western Pacific over a period of months. This gargantuan wedge of warm sea contains 20 or 30 times as much water as all the Great Lakes put together. Introduction to Tropical Meteorology, Ch. 3: Global Circulation. El Niño, La Niña and the Southern Oscillation. Effects of El Niño on the world weather. Ocean Motion : Impact : Satellites Record Weakening North Atlantic Current. Ocean Motion : Data Resources : Ocean Surface Winds.