
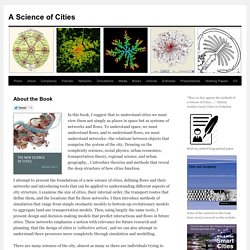
DESIGN — Stefanie Posavec. DATAlab. Is This the Oldest-Ever 3D Map of Transit Ridership? The Germans built it with colored wooden sticks around 1913.
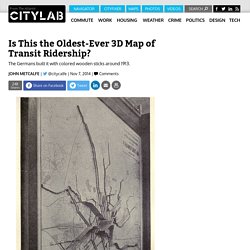
Forget GIS: All one needs to make a fascinating 3D map of ridership data is a pile of sticks, as German transit geeks proved more than a century ago. Fine, perhaps you'd also need surgeon-steady hands and unlimited patience to assemble this 8-by-8 foot masterpiece of data visualization, which to judge from the photo caption dates from around 1913. The current state or whereabouts of the map is unknown, but it lives on in the pages of Graphic Methods for Presenting Facts, a 1914 tome by Willard C. Brinton. (Credit for unearthing it goes to Dataphys.org, and for sharing it Moritz Stefaner and Eric Fischer.) So how does one read the thing? In Fig. 185 we have a map presentation in which quantities are represented by building vertically above the various routes laid out on the map. An easy once-over reveals that the heaviest ridership centered in Frankfurt's downtown areas, as would be expected.
RYOICHI KUROKAWA. HEROS DE L'ELECTRO [ syn_ ] | Audiovisual concert 15 May 2015 | Opéra Comédie [Montpellier/France] Micro Macro [ oscillating continuum ] | Audiovisual sculpture 14-25 May 2015 | Les Salins [Martigues/France] Taktung Festival [ oscillating continuum ] | Audiovisual sculpture 16-25 April 2015 | Flux Laboratories [Zurich/Switzerland] sound:frame [ syn_ ] | Audiovisual concert 9 April 2015 | MAK [Vienna/Austria] Ordered Disorder | Solo exhibition opening concert [ syn_ ] | Audiovisual concert 20 March 2015 | Espacio Fundacion Telefonica [Lima/Peru]
Data Analytics & R. Social network of Earth’s plants and animals. MIT Is Drawing 10,000 Maps To Save The World. The social computing group wants to initiate social change via data visualisation at the rate of a map a day.
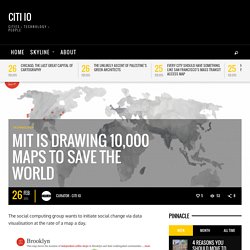
You Are Here is a project inside MIT Media lab that’s mapping 100 cities 100 times. The little things that make an otherwise cramped-and-concrete urban life worthwhile (green space, bike lanes, coffee shops) are exactly what the You Are Here project is about. Over the next two and a half years, MIT Media Lab professor Sep Kamvar will lead a team of computer scientists, artists, architects, urban planners, designers, and educators to draw 10,000 maps—that’s 100 different cities, rendered 100 times each—in hopes of illuminating the details that make cities great. Geoinformación: Links: Descarga ficheros (shapefile) GIS gratis a nivel mundial. Data Science Intern.
Data Scientist Internship @ L-3 NSS Data Tactics Supporting Data Science Team @ L-3 NSS Data Tactics L-3 NSS Data Tactics provides advanced analytics in varied forms.
Our Data Scientist are graduates from top-tier universities and have diverse backgrounds and competencies in quantitative analytic services across a full spectrum of Big Data problems to specification of models to algorithm development. The Data Tactics Data Science Team is a diverse group and tasked with identifying and solving challenges currently confronting the Defense Department, Intelligence Community (IC) as well as open problems.
Multiple projects run both internally and externally constructed, providing team members the chance to explore different focus areas, with outputs ranging from research or white papers to source code and working demos. Our Data Science Intern will work directly with this team and expected to collaborate with eachother. What companies have data science internships? A Science of Cities. In this book, I suggest that to understand cities we must view them not simply as places in space but as systems of networks and flows.
To understand space, we must understand flows, and to understand flows, we must understand networks—the relations between objects that comprise the system of the city. Drawing on the complexity sciences, social physics, urban economics, transportation theory, regional science, and urban geography, , I introduce theories and methods that reveal the deep structure of how cities function.
I attempt to present the foundations of a new science of cities, defining flows and their networks and introducing tools that can be applied to understanding different aspects of city structure. I examine the size of cities, their internal order, the transport routes that define them, and the locations that fix these networks. Job titles for data scientists. I looked at the job titles of my 7,500 LinkedIn connections, and found about 4,900 unique job titles.
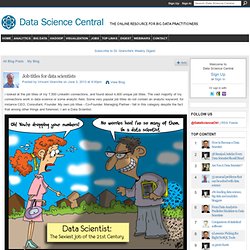
The vast majority of my connections work in data science or some analytic field. Some very popular job titles do not contain an analytic keyword: for instance CEO, Consultant, Founder. My own job titles - Co-Founder, Managing Partner - fall in this category despite the fact that among other things and foremost, I am a Data Scientist.
Tab A: data science and analytic-related job titles with 2+ LinkedIn connectionsTab B: other related job titles with 2+ LinkedIn connections (CTO, Chief Architect)Tab C: all job titles containing 'Analytic', and starting either with 'Chief' or 'Director' (see below) I am going to analyse a bigger, less structured data set. Related articles.