
Excel Solver Examples and VBA Macro. The Microsoft Excel solver add-in is one of the features that makes creating engineering and financial models in a spreadsheet a powerful tool.
To be called a "solver" doesn't do it justice, though, because it is really a powerful optimization algorithm. The tool was developed by Frontline Systems, Inc. (Solver.com) and they offer a great deal of information on their website, including products that expand upon the free Excel solver add in. This article provides a couple of examples of how to use the Excel solver and call it using a VBA macro. If you want to experiment with using the Solver on financial models, you could try it out on one of my financial calculators such as the Home Mortgage Calculator.
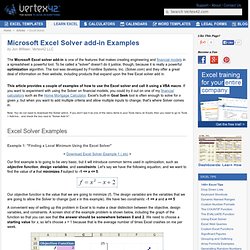
Note: You do not need to download the Solver add-in. Excel Solver Examples Example 1: "Finding a Local Minimum Using the Excel Solver" Our objective function is the value that we are going to minimize (f). Figure 1: Screenshot of example problem 1. Figure 3: Screenshot of example problem 2. Matrix calculations in Excel. Excel Tips, Excel Tutorials and Excel Examples. Excel Sum Functions. Sum a range of cells -- SUM Function The SUM function will add the numbers in a range of cells.
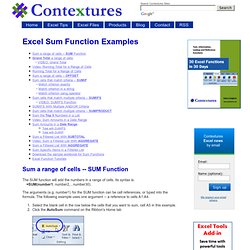
Its syntax is: =SUM(number1, number2,...number30). The arguments (e.g. number1) for the SUM function can be cell references, or typed into the formula. The following example uses one argument -- a reference to cells A1:A4. Select the blank cell in the row below the cells that you want to sum, cell A5 in this example. Click the AutoSum command on the Ribbon's Home tab Or, use the keyboard shortcut: Alt + = A SUM formula will appear in the active cell, with a reference to the cells above. Press the Enter key to complete the entry. Click the AutoSum button on the Ribbon's Home tab. Sum a range of cells -- OFFSET If you insert a row directly above the SUM function in the previous example, the new row may not be included in the SUM.
Press the Enter key to complete the entry. You can calculate a total for rows that meet a specific criterion. You can use an operator with a criterion. Making a Second Order Fit in Excel. Making a Second Order Fit in Excel David L.
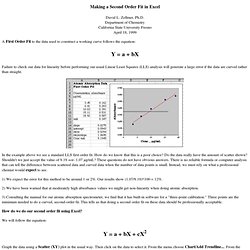
Zellmer, Ph.D. Department of Chemistry California State University Fresno April 18, 1999 Failure to check our data for linearity before performing our usual Linear Least Squares (LLS) analysis will generate a large error if the data are curved rather than straight. In the example above we see a standard LLS first order fit. How do we know that this is a poor choice? 1) We expect the error for this method to be around 1 or 2%. 2) We have been warned that at moderately high absorbance values we might get non-linearity when doing atomic absorption. 3) Consulting the manual for our atomic absorption spectrometer, we find that it has built-in software for a "three-point calibration. " How do we do our second order fit using Excel? We will follow the equation: Graph the data using a Scatter (XY) plot in the usual way.
Under Options, choose Display Equation on Chart You can let Excel solve the quadratic equation for you using Goal Seek. Cell D27=B27-C27. Automating Goalseek.