
Emprise JavaScript Charts™ jQuery Sparklines. News 15 June 2013 - Version 2.1.2 Relased This release adds support for jQuery 1.10.0 and other bug fixes and minor improvements.
See the full changelog for details of all changes. 26 January 2013 - Version 2.1.1 Relased This release adds support for jQuery 1.9.0 along with a couple of other bug fixes. If you're using a version of jQuery later than 1.8, be extra sure you're not rendering your page in quirks mode to avoid breaking tooltips for IE users. See jQuery's notes on quirks compatiblity for more info. See the full changelog for details of all changes. 15 October 2012 - Version 2.1 Released This release is primarily a bug-fix release, but also adds support for Internet Explorer 10. See the full changelog for details of all changes. 29 April 2012 - Version 2.0 Released This release represents a significant code update.
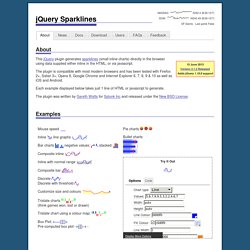
Customizable mouseover tooltips and interaction including highlighting of moused-over values. There's a few non-code updates as well: eg. This release also: Documentation. PlotKit - Javascript Chart Plotting. PlotKit is a Chart and Graph Plotting Library for Javascript.
It has support for HTML Canvas and also SVG via Adobe SVG Viewer and native browser support. PlotKit is fully documented and there is a quick tutorial to get you started. PlotKit is a complete rewrite of CanvasGraph. It is better structured and supported. Requirements MochiKit 1.3 or higherHTML Canvas: Safari 2+, Opera 9+, Firefox 1.5+, IE 6 (in emulated mode)SVG: Opera 9+, Firefox 1.5+ (see note), IE6 with Adobe SVG. Note: Firefox 1.5+ on Linux and Windows is supported. License(s) PlotKit is copyright (c) 2006 Alastair Tse. Get/Download Below is a demo of a simple HTML Canvas example which should work in Safari 2, Firefox 1.5, Internet Explorer 6 and Opera 9. This is the HTML in the above demo: And the Javascript that is needed to draw the charts: If you do not see the above, this is what you should have seen: PlotKit was created by: Alastair Tse - alastair@liquidx.net.
Flot - Attractive Javascript plotting for jQuery. Flotr: Playground. Charts and Graphs for jQuery. Anatomia de um mashup em HTML5 e CSS. Para os fãs de Daft Punk, um mashup com 23 músicas acompanhados de uma visualização em HTML5 e CSS3. Vale a pena conferir em Esta entrada foi publicada em Geek life. Adicione o link permanente aos seus favoritos. Home. Hello, this is the Open Flash Chart project.
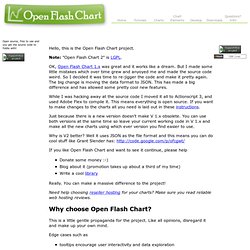
Note: "Open Flash Chart 2" is LGPL. OK, Open Flash Chart 1.x was great and it works like a dream. But I made some little mistakes which over time grew and anyoyed me and made the source code weird. So I decided it was time to re-jigger the code and make it pretty again. The big change is moving the data format to JSON. While I was hacking away at the source code I moved it all to Actionscript 3, and used Adobe Flex to compile it. Just because there is a new version doesn't make V 1.x obsolete. Why is V2 better? If you like Open Flash Chart and want to see it continue, please help Donate some money :-) Blog about it (promotion takes up about a third of my time) Write a cool library Really. Need help choosing reseller hosting for your charts? Bluff: Beautiful graphs in JavaScript. Sinon.JS - Versatile standalone test spies, stubs and mocks ... AmCharts: Flash and JavaScript charts, stock charting software.
Demo Gallery. gRaphaël—Charting JavaScript Library.