
Trace2uml: Drawing sequence diagrans in Doxygen. From Doxygen version 1.5.3 doxygen supports sequence charts inside the documentation. Original doxygen works together with mscgen (a tool similar to Trace2UML). But because Trace2UML is now call compatible with mscgen, you can use Trace2UML instead. The only thing you have to do by hand, is to RENAME "Trace2UML.exe" into "mscgen.exe" (or do a symbolic link, on Linux). This is because Doxygen has the tool name hard coded in its binary (maybe this will change one day ;-) So follow the Doxygen documentation to insert a sequence diagram with the commands "\msc" and "\endmsc" but use Trace2UML syntax to describe the sequence diagram: Than Doxygen will place the following graphic into your documentation: Doxygen meets SEQUENCE diagrams. I’ve been tinkering with Doxygen and SEQUENCE (see my previous post on this) to make them play well together for the documentation of the Daversy project.
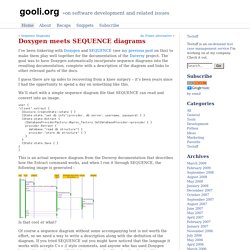
The goal was to have Doxygen automatically incorporate sequence diagrams into the resulting documentation, complete with a description of the diagram and links to other relevant parts of the docs. I guess there are up sides to recovering from a knee surgery – it’s been years since I had the opportunity to spend a day on something like this. Itymbi ...: SEQUENCE Archives. October 17, 2004 Version 9 of SEQUENCE The only change is that the source jar file now contains the data for the help files, such as they are.

Here are sequence_src.jar and sequence.jar . Posted by Alex. Permalink Sequence is great! I really like sequence - but one question remains .. 1. A little Addition ;-) it would be nice, if Sequence displays object creation more the standard way... e.g. Graphviz. WebSequenceDiagrams.com - Draw and Edit Sequence Diagrams in seconds. Pic2Plot – trac – Trac. This plugin will convert the PIC Graphical Language to an image.
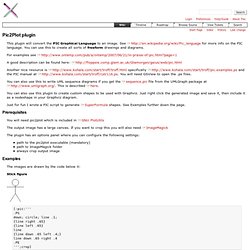
See for more info on the PIC language. You can use this to create all sorts of freeform drawings and diagrams. For examples see A good description can be found here: Another nice resource is specifically and the PIC manual at You will need GSView to open the .ps files. You can also use this to write UML sequence diagrams if you get the sequence.pic file from the UMLGraph package at This is described here. You can also use this plugin to create custom shapes to be used with Graphviz.
Just for fun I wrote a PIC script to generate SuperFormula shapes. Prerequisites ¶ You will need pic2plot which is included in GNU PlotUtils The output image has a large canvas. The plugin has an options panel where you can configure the following settings: path to the pic2plot executable (mandatory) path to ImageMagick folder always crop output image Examples ¶ The images are drawn by the code below it: Stick figure. Pic2Plot. Doxygen meets SEQUENCE diagrams. Forever For Now - UML Diagrams Using Graphviz Dot.
Introduction Background This article is about using the dot tool from the Graphviz package to automatically generate UML diagrams on the fly.
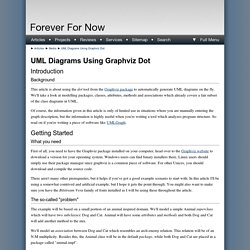
We'll take a look at modelling packages, classes, attributes, methods and associations which already covers a fair subset of the class diagrams in UML. Of course, the information given in this article is only of limited use in situations where you are manually entering the graph description, but the information is highly useful when you're writing a tool which analyzes program structure. So read on if you're writing a piece of software like UMLGraph. Getting Started What you need First of all, you need to have the Graphviz package installed on your computer, head over to the Graphviz website to download a version for your operating system.
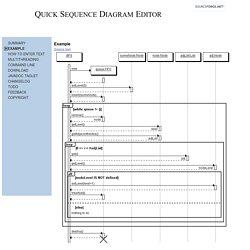
There aren't many other prerequisites, but it helps if you've got a good example scenario to start with. The so-called "problem" The example will be based on a small portion of an animal inspired domain. Graphics - Drawing Sequence Diagrams. Quick Sequence Diagram Editor - Example. Source text.
PlantUML Gizmo - Google Workspace Marketplace. Les 7 meilleurs logiciels d'organigramme gratuits pour Windows - Moyens I/O. Web Server. Can we format the decision tree part of plantuml with a different color. PlantUML Gizmo - Google Workspace Marketplace. PlantUML Editor. Using PlantUML in VSCode. Diagramme de séquence syntaxe et caractéristiques. Exemples de base La séquence -> est utilisée pour dessiner un message entre deux participants.
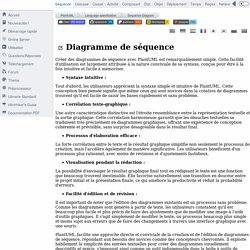
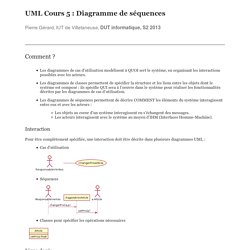
Les participants ne sont pas forcément déclarés explicitement. Pour avoir une flèche en pointillé, vous utilisez --> Il est également possible d'utiliser <- et <--. Cela ne change pas le dessin, mais peut améliorer la lisibilité. UML Cours 5 : Diagramme de séquences. Les diagrammes de cas d’utilisation modélisent à QUOI sert le système, en organisant les interactions possibles avec les acteurs.Les diagrammes de classes permettent de spécifier la structure et les liens entre les objets dont le système est composé : ils spécifie QUI sera à l’oeuvre dans le système pour réaliser les fonctionnalités décrites par les diagrammes de cas d’utilisation.Les diagrammes de séquences permettent de décrire COMMENT les éléments du système interagissent entre eux et avec les acteurs :Les objets au coeur d’un système interagissent en s’échangent des messages.Les acteurs interagissent avec le système au moyen d’IHM (Interfaces Homme-Machine).
Interaction. Using PlantUML in VSCode. Pages de spécification de la langue.