
Business Process Analysis. Summary Design, document, analyze, optimize and communicate processes to achieve business process excellence by using the ARIS Business Process Analysis Platform.
With more efficient processes across business, IT and SAP systems, your Digital Enterprise can respond to changing business and market requirements more quickly. Consulting Services - Leadership Development - Business Training - Kepner-Tregoe. Affinity Diagram Tutorial. Named after the Italian economist, Vilfredo Pareto, the Pareto Chart is a tool used to rank the various categories/causes of a problem by charting them as bars in descending order of frequency or magnitude from left to right.
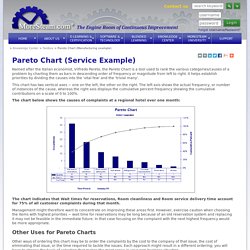
It helps establish priorities by dividing the causes into the ‘vital few’ and the ‘trivial many’. This chart has two vertical axes − one on the left, the other on the right. The left axis shows the actual frequency, or number of instances of the cause, whereas the right axis displays the cumulative percent frequency showing the cumulative contributions on a scale of 0 to 100%. The chart below shows the causes of complaints at a regional hotel over one month: The chart indicates that Wait times for reservations, Room cleanliness and Room service delivery time account for 75% of all customer complaints during that month. Management might therefore want to concentrate on improving these areas first. Other Uses for Pareto Charts Summary Like this tutorial? 10 Tips - Business Scorecard KPIs and Ongoing Quality Control. Although a business or balanced scorecard is not a quality control tool, we see among users of BSC Designer that many professionals apply the KPI scorecard and specifically use a Balanced Scorecard approach for ongoing quality control.
In this article I summarize some of the best practices that I can recommend according to case studies that we did with our clients. Feel free to share your thoughts and experience about quality indicators on a scorecard in the comments section. 1. Business context comes first, then come indicators. The Lean Office - 5S Office. This is the point where many people become unstuck and go too far in some cases, we are not looking to label every hole punch and stapler and have small squares taped on the desks identifying where they belong for every member of the office staff, although this may be a reasonable move for the desk beside the photocopier if people are always hunting for the stapler here!
How to implement Lean in an Office. The 7 Types of Waste. Jll-au-activity-based-working-2012.pdf. A powerful combination for process improvement. Develop and deploy your nextapp on the IBM Bluemixcloud platform.
Start your free trial Lean - what it is and how it works With a history of more than fifty years, Lean thinking focuses on value for the customer by eliminating waste in an end-to-end process. It establishes flow and implements a "one-piece" pull system. It strives to achieve perfection through continuous improvement. Figure 1 provides a concise summary of Lean's key principles: Business value is key.Identify all steps (value added and non-value added).Align the steps in sequence to establish flow.Implement a pull mechanism to work downstream.Eliminate waste through improvement and optimization. Figure 1. Lean process improvement provides many tools and methods to detect and eliminate waste. The seven prominent wastes of Lean, also known as TIMWOOD, are a common denominator found in many business processes. Figure 2. Key challenges Back to top How business process management complements Lean Type 1 Type 2 Type 3 Figure 3.
Figure 4. DMAIC. DMAIC is the most frequently used roadmap in Lean Six Sigma.
The objective is to find root causes to problems in processes instead of trying to cure symptoms. We teach a methodology, which is based heavily on "common sense". We also teach what questions you should ask yourself in an improvement project, ie critical thinking. To help answer these questions we introduce dedicated and powerful tools.
There are tools that are well known but which are now linked to a methodology. DMAIC Versus DMADV. We know that everything in business is a process, right?
Sales people have a list of companies and contacts that they work in a certain fashion to produce a sale, production receives an order and schedules the manufacturing, the product is built, packaged, shipped and invoiced. When the packing department has a problem with their process, though, should they fix it with a DMAIC or DMADV (also referred to as DFSS) type project? Yonatan Reshef: Quality Circle. Lean Six Sigma Certification Video Training eLearning ONLINE. CPS (Creative Problem Solving) model.
Notes from Gary Davis's Creativity is Forever - 1998 Kendall Hunt The strategy originally was formulated by Alex Osborn (1963), creator of brainstorming, founder of the Creative Education Foundation (CEF) and co-founder of a highly successful New York advertising agency.
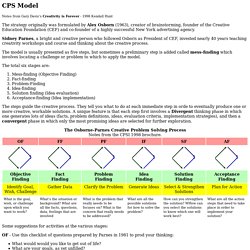
Sidney Parnes, a bright and creative person who followed Osborn as President of CEF, invested nearly 40 years teaching creativity workshops and course and thinking about the creative process. Six Sigma Complete Project Example HD. Return on Quality (ROQ): Making Service Quality Financially Accountable. ASQ Service Quality Division. Cost-Benefit AnalysisSkill level: Intermediate DescriptionA cost-benefit analysis is a study to determine the relationship between the benefits and the costs of changes to processes, policies, and/or procedures.
The costs should be stated in financial units (e.g., Dollars, Pesos, Euros, etc.).