
SPC Simplified - Control Charts. Online Browsing Platform (OBP) Quality Digest Magazine. By Mike Richman “The quality manager must be clear, right from the start, that zero defects is not a motivation program.
Its purpose is to communicate to all employees the literal meaning of the words ‘zero defects’ and the thought that everyone should do things right the first time.” --Quality Is Free by Philip B. Crosby (McGraw-Hill Books, 1979) Defects. That being said, the quest for zero defects can still be considered quality’s Holy Grail. Of course, there’s a huge difference between reducing defects and eliminating them, and therein lies the seeds of debate.
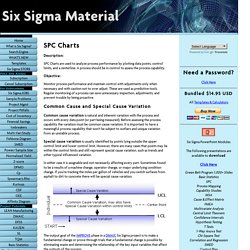
There’s also the matter of defining exactly how quality is to be achieved. “It’s important to create a culture of prevention, which causes people to prevent defects and nonconformities,” says Kevin Weiss, CEO of The Capability Group and Philip Crosby Associates. In most cases, the biggest factor in a company’s quality program is cost. SPC Simplified - Capability Analysis with Histograms, Cp and Cpk. Quality Tools. How to Create a Control Chart: 18 Steps. Six Sigma Material. SPC Charts - Statistical Process Control Charts. Description: SPC Charts are used to analyze process performance by plotting data points, control limits, and a centerline.
Statistical Process Control (SPC) Tutorial. Introduction and Background The concepts of Statistical Process Control (SPC) were initially developed by Dr.
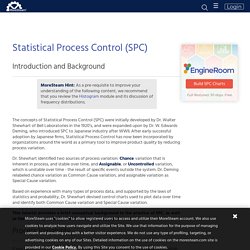
Walter Shewhart of Bell Laboratories in the 1920's, and were expanded upon by Dr. W. Edwards Deming, who introduced SPC to Japanese industry after WWII. After early successful adoption by Japanese firms, Statistical Process Control has now been incorporated by organizations around the world as a primary tool to improve product quality by reducing process variation. Dr. Based on experience with many types of process data, and supported by the laws of statistics and probability, Dr. This tutorial provides a brief conceptual background to the practice of SPC, as well as the necessary formulas and techniques to apply it. Process Variability In order to work with any distribution, it is important to have a measure of the data dispersion, or spread. Example Why Is Dispersion So Important?
Free Lean Six Sigma Resources & QI Macros 30 Day Trial. Home » Free Resources Instead of spending countless dollars and hours trying to implement Lean Six Sigma, use the QI Macros and Jay's streamlined approach to Lean Six Sigma.
We’re all about making the complex simple. Visit QIMacros.com in a full web browser for complete support or contact us online. Free Resources Lean Six Sigma Money Belt Training View Lean Six Sigma "Money Belt" training videos created by Jay Arthur, a Money Belt with more than 30 years of experience in aligning people, process and technology in a wide variety of environments to deliver bottom-line business results. Free Webinars Watch previously recorded Lean Six Sigma webinars on a variety of topics, including Lean Six Sigma Demystified, Lean Six Sigma for Healthcare and the QI Macros. Free QI Macros Trial with Special Bonuses. Starting and Advancing a BPM Measurement System. Do you know how each process is performing right now in your organization?
And if you’ve improved a particular process do you know if you achieved the level of improvement you wanted? It’s necessary to quantify data to be able to answer these two questions and provide objective ways to measure process and level of change. So if you’re working on a single business process improvement project or many processes across the enterprise, you need a measurement system. But how do you build one that is comprehensive, efficient and effective? Where do you start? Root Cause Analysis Software. RealityCharting® software is a powerful Root Cause Analysis (RCA) tool used to assist facilitators and compliment the Apollo Root Cause Analysis methodology.
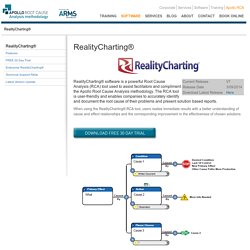
The RCA tool is user-friendly and enables companies to accurately identify and document the root cause of their problems and present solution based reports. When using the RealityCharting® RCA tool, users realise immediate results with a better understanding of cause and effect relationships and the corresponding improvement in the effectiveness of chosen solutions. Some of the benefits of using the RealityCharting® RCA tool include increased proficiency, a more efficient review process, shortened investigation cycle times and improved stakeholder confidence in solutions. The RealityCharting® RCA tool is available either as a standalone license and is also available as an Enterprise license. Both Standalone and Enterprise server versions run on either Windows or Apple operating systems. Callcentermetricspaperbestpr.pdf. Honda Statistical Process Control. Perfomance management services.
Shareholder value: it’s what business is all about, it’s the bottom line.
But creating, maintaining and communicating shareholder value is an increasingly complex process. In a post-financial crisis economy with markets in flux and investors still tentative, creating shareholder value is a bigger challenge than it’s ever been. And as companies compete for available dollars, it’s difficult to identify an opportunity and know how to take advantage of it. Beyond building value, companies often neglect to communicate value – the processes that drive it and the metrics that define it – to shareholders or to the enterprise at large. If value isn’t both fixed in corporate culture and disseminated clearly to shareholders, confidence and future investments can be imperilled and growth initiatives put at risk. The cost of failure in today’s market is high. These capabilities allow you to integrate data capture, processing, analysis and information with key finance process requirements.