
Create beautiful statistical graphics with ggplot2. R has a very powerful graphics system, with low-level tools allowing customization of every detail and even setting up the page to show multiple graphics at once, aligning related data in meaningful ways.
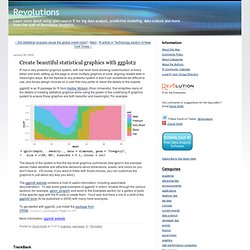
But the flipside to any powerful system is that it can sometimes be difficult to use, and forces design choices on a user that may prefer to leave the details to the experts. ggplot2 is an R package for R from Hadley Wickam (Rice University), that simplifies many of the details of creating statistical graphics while using the power of the underlying R graphics system to ensure those graphics are both beautiful and meaningful. For example: The beauty of the system is that the top-level graphics commands (like qplot in the example above) make sensible and attractive decisions about dimensions, scales, and colors so you don't have to. (Of course, if you want to tinker with those choices, you can customize the graphics in just about any way you want.) Visualising data with R - had - blip.tv.
Ggplot. had.co.nz.