
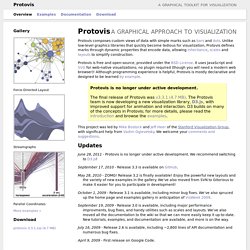
VisiStat Visitor Tracking Web Analytics. Protovis. Protovis composes custom views of data with simple marks such as bars and dots.
Unlike low-level graphics libraries that quickly become tedious for visualization, Protovis defines marks through dynamic properties that encode data, allowing inheritance, scales and layouts to simplify construction. Protovis is free and open-source, provided under the BSD License. It uses JavaScript and SVG for web-native visualizations; no plugin required (though you will need a modern web browser)!