
Analyzing 'eSDDO' Avis banque. Scheduled Posts - Timely. Dear Timely User, Timely started as a fun side project back in 2010.

Since then it has grown to help tens of thousands of people publish millions of Tweets and Facebook updates. We're proud of that. And happy we could help you manage your hectic world of social media. Unfortunately we haven't been giving Timely much attention recently as we've been focusing on Demandforce's paid products. So we made the hard decision to retire Timely. When we launched Timely almost 2 years ago there were no other tools that would automatically figure out the best time for a Tweet to go out.
Thankfully there are some great alternatives today such as Buffer or Hootsuite. I should also note that a version of Timely is still available to Demandforce customers. Thank you for being a part of the Timely story, Ethan Bloch, Assaf Arkin and David John. Common Twitter friends of aponcier and garniera: Twiangulate. Les Réseaux sociaux d'entreprise pour développer le potentiel social. Propositions méthodologiques pour l’amélioration automatique des contrastes de couleur - application aux cartes de risque. 1La carte est un instrument ancien qui est devenu omniprésent et de qualité croissante pour transmettre des informations dans de très nombreux domaines comme celui des risques. Leur multiplication s’explique par le développement majeur des outils informatisés et la diversification des champs d’application où on les utilise. 2Or, la carte numérique accessible à tous peut avoir une lisibilité réduite (Chesneau, 2004), notamment parce que les Systèmes d’Information Géographique (SIG) n’offrent pas d’outils d’analyse des légendes et les travaux théoriques en cartographie comme ceux de J.
Bertin (Bertin, 1967) ne sont pas introduits dans de tels outils. 3Nous proposons un modèle d’amélioration automatique des contrastes colorés pour aider un professionnel à créer des cartes lisibles qui lui serviront efficacement dans son travail. Figure 1. 4Dans cet article, le schéma de données ne sera pas présenté (cf. 65 Terrific Social Media Infographics. 65 Terrific Social Media Infographics As you know, infographics are visual representations of information, data, or knowledge.
They present complex concepts quickly and clearly, and communicate ideas in an easily understandable fashion. Last year, I assembled a collection of 35 infographics that told the story of social media at that time. That post proved to be so popular that I wanted to update it, including images that are still relevant and adding newer visualizations that illustrate more recent knowledge and insights into the social Web. Since social media marketing is a relatively recent addition to organizations’ integrated marketing communications plans, it’s imperative for marketing professionals to gain as much understanding as possible about how people leverage social media for everyday interaction. Most of these have been cropped or scaled down — please click on each image or its title to see the full-sized version.
The History of Social Networking The State of the Internet. Strange Maps. Et si on mesurait la notoriété plutôt que la popularité ? Le propre du sondage d'opinion politique est généralement de mesurer la cote de popularité d'une personnalité politique : qu'il s'agisse d'un baromètre consacré à l'action du Président de la République ou de mesurer la part des intentions de vote de chaque candidat à l'élection présidentielle, on se préoccupe essentiellement du fond, au détriment de la forme.
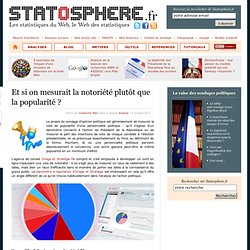
Pourtant, là où une personnalité politique parvient laborieusement à convaincre, une autre glanera peut-être la même popularité en un minimum d'effort. CB-nj.pdf (Objet application/pdf) Software FX Gallery. Mayavi/Gallery – ETS. Wiki: Mayavi / Gallery Context Navigation Last modified 5 years ago Attachments bayesian_estimator.png ( 144.5 KB ) - added by GaelVaroquaux 5 years ago. Mayavi - 3D scientific data visualization and plotting. The Mayavi project includes two related packages for 3-dimensional visualization: Mayavi: A tool for easy and interactive visualization of data, with seamless integration with Python scientific libraries.
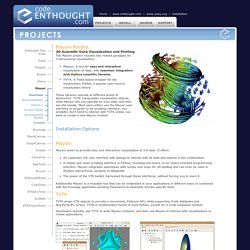
TVTK: A Traits-based wrapper for the Visualization Toolkit, a popular open-source visualization library. These libraries operate at different levels of abstraction. TVTK manipulates visualization objects, while Mayavi lets you operate on your data, and then see the results. Most users either use the Mayavi user interface or program to its scripting interface; you probably don't need to interact with TVTK unless you want to create a new Mayavi module. Un Atlas des Cyberespaces - Cartes d'Espaces Informationnels. Browsing visualizations.
Treemap. SuperPowerPoint. MindMapping. Ideas, issues, concepts, subjects - v. AmCharts: Flash and JavaScript charts, stock charting software. A Periodic Table of Visualization Methods.
Kap Lab: Flex data visualization components and development optimization tools. Overview. We're thrilled to announce the launch of Processing 2.0—the latest incarnation of the programming language, development environment, and online community that has grown dramatically since its debut in 2001.
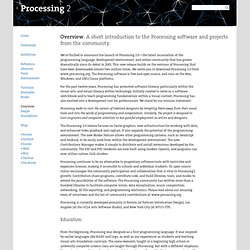
This new release builds on the versions of Processing that have been downloaded almost two million times. We invite you to download Processing 2.0 from www.processing.org. The Processing software is free and open source, and runs on the Mac, Windows, and GNU/Linux platforms. For the past twelve years, Processing has promoted software literacy, particularly within the visual arts, and visual literacy within technology. Initially created to serve as a software sketchbook and to teach programming fundamentals within a visual context, Processing has also evolved into a development tool for professionals. Processing seeks to ruin the careers of talented designers by tempting them away from their usual tools and into the world of programming and computation.
Education. Treevis.net.