
Free Geocoding Addresses/Address Matching and Reverse-Geocoding for 24 Countries and Areas. Batch Géocodeur - géocodage google map en français gratuit. Google Maps API Tutorial. Exploring The Google Earth API - DevelopRIA. Tour at GeoCommons. GeoCommons is the public community of GeoIQ users who are building an open repository of data and maps for the world.
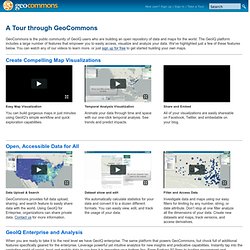
The GeoIQ platform includes a large number of features that empower you to easily access, visualize and analyze your data. We've highlighted just a few of these features below. You can watch any of our videos to learn more, or just sign up for free to get started building your own maps. Chart Tools - Google Code. Visualization: Geochart - Google Chart Tools - Google Code. Overview A geochart is a map of a country, a continent, or a region with two modes: The region mode colorizes whole regions, such as countries, provinces, or states.

The marker mode marks designated regions using bubbles that are scaled according to a value that you specify. Getting Started - Google Maps JavaScript API V3 - Google Code. Audience This documentation is designed for people familiar with JavaScript programming and object-oriented programming concepts.

You should also be familiar with Google Maps from a user's point of view. There are many JavaScript tutorials available on the Web. This conceptual documentation is designed to let you quickly start exploring and developing applications with the Google Maps API. Maps Javascript API V3 Reference - Google Maps JavaScript API V3 - Google Code. Release Version Last updated Monday, February 17, 2014 This reference documents version 3.15 (the release version) of the Maps Javascript API released November 15, 2013.

This release version of the API is a feature-stable version of the API whose interfaces are guaranteed to remain as documented within these pages until this version is retired. To consult the latest (experimental) version of the Maps Javascript API, see the Experimental Development Reference. Reference Table of Contents Map Controls. Overlays - Google Maps JavaScript API V3 - Google Code. GPS Visualizer map input form: Plot quantitative data. This is a special version of the GPS Visualizer map form that's designed for plotting quantifiable data on a map.
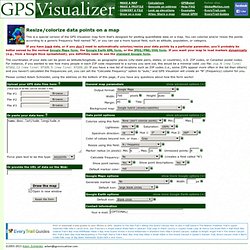
You can colorize and/or resize the points according to a generic frequency field named "N", or you can use a more typical field, such as altitude, population, or category. If you have track data, or if you don't need to automatically colorize/resize your data points by a particular parameter, you'll probably be better served by the normal Google Maps form, the Google Earth KML form, or the JPEG/PNG/SVG form. If you want your map to load markers dynamically (e.g., from a Google Docs spreadsheet), you definitely need to use the standard Google form. The coordinates of your data can be given as latitude/longitude, as geographic places (city-state pairs, states, or countries), U.S. Draw a map from a GPS data file.
GPS Visualizer's Easy Batch Geocoder: Convert street addresses to coordinates. NOTE: You'll need to get your own free API key to process a large number of addresses using this page.
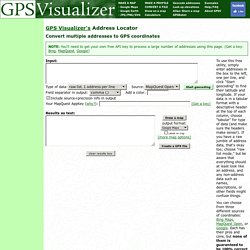
(Get a key: Bing, MapQuest, Google) What this page is for GPS Visualizer's primary function is mapping and converting GPS data; it was never intended to be a geocoding site. However, over the years many people have found GPS Visualizer to be useful with address-based data as well, so this page was created as a convenient way to bridge the gap between addresses and true coordinates. After you add latitudes and longitudes to your waypoints/addresses/POIs, you should be able to use them with GPS Visualizer's "normal" input forms. How it works. FAQ. Good question.

It seems that printing maps created using the Google Maps API is unreliable at best. Every browser seems to behave a little bit differently, so any "tricks" to make it work in, say, Firefox, might cause everything to blow up in Internet Explorer. The safest bet is to simply take a screen shot and print that. Here are some tips on doing that: Firefox (any platform): try installing a Firefox add-in that can capture the entire contents of a browser window — even the parts that are currently off-screen. Mac OS X: The keystroke Command-Shift-3 will save a picture of your entire screen to your Desktop. Windows: Hitting the Print Screen key copies the contents of the entire screen to the clipboard, and from there you can paste it into a graphics program — even MS Word or "Paint," if you don't have anything fancier.
Leydesdorff - Patentmaps. Mapping (USPTO) Patent Data using Overlays of Google Maps Journal of the American Society for Information Science and Technology 63(7) (2012) 1442-1458. available at Figure 1: Map of 2,946 USPTO-patents recalled using the search string “ttl/nano$ and (isd/2008$$ or isd/2009$$ or isd/2010$$)”; with 78 inventors participating in the top-quartile for “Seoul (KR);” above expectation at the level p< 0.05.

(The interactive map can be found at .) The mapping of overlays using Google Maps requires downloading of the following computer programs: 1. uspto1.exe for the initial download at the interface of USPTO (advanced searching at 2. uspto2.exe for the organization of the databases from the retrieval under 1; 3. patref3.exe for downloading the numbers of citations for each patent downloaded under 1; uspto2.exe generates an input file for this routine; 4. patref5.exe for the generation of the overlays for Google Maps. USPTO nanotechnology 2008-2010 (integer counting) French departments shapefile. Description de l'ensemble des unités administratives de France métropolitaine et DOM et Mayotte : communes, cantons, arrondissements, départements, régions.

GEOFLA® permet à des échelles nationales et régionales de situer toute information thématique, d'analyser des données statistiques et de gérer des déplacements routiers. Les plus Base de données synthétique et simple d'utilisation permettant un survol exhaustif de la France administrativeROUTE 500®, ROUTE 120® et GEOFLA® constituent une gamme de produits compatibles ente eux, faciles d'emploi Formats. Fonds de cartes - IGN.FR - Education.