
Raging Bulls: How Wall Street Got Addicted to Light-Speed Trading. Photo: Tim Flach/Getty Wall Street used to bet on companies that build things.

Now it just bets on technologies that make faster and faster trades. Editor’s note: One of the most interesting things about the catastrophe at Knight Capital Group—the trading firm that lost $440 million this week—is the speed of the collapse. News reports describe the bulk of the bad trades happening in less than an hour, a computer-driven descent that has the financial community once again asking if its pursuit of profits has led to software agents that are fast yet dumb and out of control. We’re posting this story in advance of its publication in Wired’s September issue because it examines how Wall Street has gotten to the point where flash failures come with increasing frequency, and how much further traders seem willing to go in pursuit of ever-greater speed.
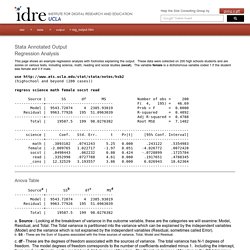
If that were all it took, then by now someone would be building one. This movement has been gaining momentum for more than a decade. Datenjournalist - OpenData und neue Journalismusformen. Open Data Tools - Home. Open Data Showroom - Home. David McCandless. David McCandless. Annotated Stata Output: Regression. Stata Annotated Output Regression Analysis This page shows an example regression analysis with footnotes explaining the output.

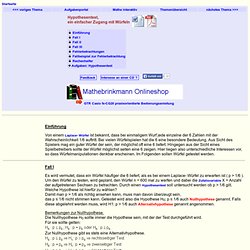
These data were collected on 200 high schools students and are scores on various tests, including science, math, reading and social studies (socst). The variable female is a dichotomous variable coded 1 if the student was female and 0 if male. Khanacademy. Einfacher Zugang zum Hypothesentest. Einführung Von einem Laplace- Würfel ist bekannt, dass bei einmaligem Wurf jede einzelne der 6 Zahlen mit der Wahrscheinlichkeit 1/6 auftritt.

Bei vielen Würfelspielen hat die 6 eine besondere Bedeutung. Aus Sicht des Spielers mag ein guter Würfel der sein, der möglichst oft eine 6 liefert. Hingegen aus der Sicht eines Spielbetreibers sollte der Würfel möglichst selten eine 6 zeigen. Hier liegen also unterschiedliche Interessen vor, so dass Würfelmanipulationen denkbar erscheinen. Fall I Es wird vermutet, dass ein Würfel häufiger die 6 liefert, als es bei einem Laplace- Würfel zu erwarten ist ( p > 1/6 ). Bemerkungen zur Nullhypothese. Zur Nullhypothese gibt es stets eine Alternativhypothese. Eine Entscheidung für H0 führt stets zur Ablehnung von H1. Der Fehler, der bei der Entscheidung gemacht werden kann, soll auf höchstens 5% beschränkt werden. Ein Annahmebereich und ein Ablehnungsbereich zu berechnen. DSS - Stata. Home Online Help Statistical Packages Stata Creating and Modifying Variables Before reading this, make sure that you understand roughly what Stata variables are and how they work.

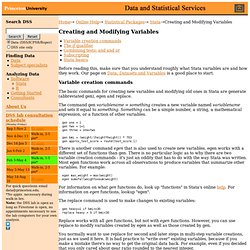
Variable creation commands The basic commands for creating new variables and modifying old ones in Stata are generate (abbreviated gen), egen and replace. The command gen variablename = something creates a new variable named variablename and sets it equal to something. . gen one = 1 . gen two = 1+1 . gen three = one+two . gen bmi = (weight/(height*height)) * 703 . gen approx_test_score = round(test_score,1) There is another command egen that is also used to create new variables. egen works with a different set of functions than gen. . egen max_weight = max(weight) . egen sumofallweights=sum(weight) For information on what gen functions do, look up "functions" in Stata's online help.
The replace command is used to make changes to existing variables: Stata FAQ: How can I recode missing values into different categories? Stata FAQ How can I recode missing values into different categories?

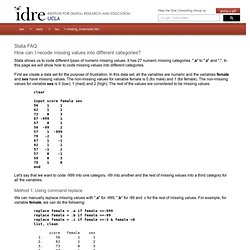
Stata allows us to code different types of numeric missing values. It has 27 numeric missing categories. ".a" to ".z" and ". ". In this page we will show how to code missing values into different categories. First we create a data set for the purpose of illustration. In this data set, all the variables are numeric and the variables female and ses have missing values. Clear input score female ses 56 1 1 62 1 2 73 0 3 67 -999 1 57 0 1 56 -99 2 57 1 -999 78 -2 1 67 1 -1 92 1 1 57 -1 2 57 0 -1 58 0 3 78 1 0 end Let's say that we want to code -999 into one category, -99 into another and the rest of missing values into a third category for all the variables.
Method 1: Using command replace We can manually replace missing values with ".a" for -999, ".b" for -99 and .c for the rest of missing values. The codebook command above shows that variable female has three types of missing values and 4 missing values.