
Know Thy Java Object Memory Layout. Sometimes we want to know how an object is laid out in memory, here's 2 use cases and 2 solutions which remove the need to hypothesise.

A few months back I was satisfying my OCD by reading up on java object memory layout. Now Java, as we all know and love, is all about taking care of such pesky details as memory layout for you. You just leave it to the JVM son, and don't lose sleep over it. Sometimes though... sometimes you do care. And when you do, here's how to find out. In theory, theory and practice are the same Unaligned access is bad, so JVM saves you from bad layout (unaligned access to memory can cause all sorts of ill side effects, including crashing your process on some architectures)Naive layout of your fields would be wasting memory, the JVM reorders fields to improve the overall size of your objectJVM implementation requires types to have consistent layout, thus requiring the sub class rules So... nice clear rules, what could possibly go wrong?
False False Sharing Protection. Java Memory Model From a Programmer's Point-of-View. Programmers at large often feel difficult to learn Java Memory Model (JMM for short) from either Java Language Specification Third Edition (JLSv3 for short)[11] or Java Virtual Machine Specification Second Edition (JVMSv2 for short)[12] due to several reasons.
One is he/she lacks basic understanding of out-of-order execution in modern CPUs and compilers. Next is there are so many academic terms in JLSv3 and JVMSv2 documentations. Informal explanations along with detailed examples are often needed before going further. Lastly a programmer really doesn’t need to know all of JMM in order to make thread safe programs.This article tackles JMM from these three angles.
Here is the quote for JMM definition from JLSv3 “A memory model describes, given a program and an execution trace of that program, whether the execution trace is a legal execution of the program. For our demo purpose we break down a CPU instruction cycle without loss of generality as follows: 01.class ReadWriteExample { 08. 18. 3. Software.intel.com/sites/products/collateral/hpc/vtune/performance_analysis_guide.pdf. DTrace meets the CPU Performance Counters (Jon Haslam's Weblog) It's been a while coming but it's here at last in build 109 of Solaris Nevada; the DTrace CPU Performance Counter provider (or 'cpc' provider for short).
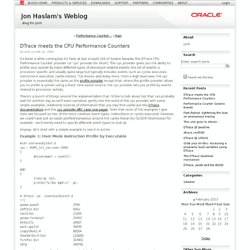
The cpc provider gives you the ability to profile your system by many different types of processor related events; the list of events is processor specific and usually quite large but typically includes events such as cycles executed, instructions executed, cache misses, TLB misses and many more. From a high level view, the cpc provider is essentially the same as the profile provider except that, where the profile provider allows you to profile a system using a fixed, time based source, the cpc provider lets you profile by events related to processor activity. /dev/websphere: btrace for performance tuning. Using VisualVM, BTrace & Good Old Web Search. The story starts with my pattern of being off the grid half of each day.
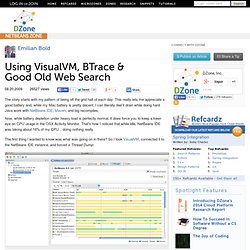
This really lets me appreciate a good battery and, while my Mac battery is pretty decent, I can literally feel it drain while doing hard Java work with NetBeans IDE, Maven, and big recompiles. Now, while battery depletion under heavy load is perfectly normal, it does force you to keep a keen eye on CPU usage in the OSX Activity Monitor. That's how I noticed that while idle, NetBeans IDE was taking about 16% of my CPU... doing nothing really. The first thing I wanted to know was what was going on in there? So I took VisualVM, connected it to the NetBeans IDE instance, and forced a Thread Dump:
EurekaJ Profiler - BTrace Script Concepts. At the heart a BTrace Script is a normal Java class annotated with BTrace annotations to tell the BTrace agent what and how to instrument your Java Application.
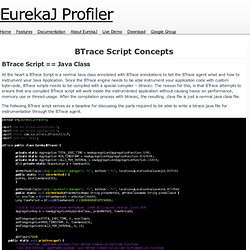
Since the BTrace engine needs to be able instrument your application code with custom byte-code, BTrace scripts needs to be compiled with a special compiler – btracec. The reason for this, is that BTrace attempts to ensure that any compiled BTrace script will work inside the instrumented application without causing havoc on performance, memory use or thread-usage. After the compilation process with btracec, the resulting .class file is just a normal java class file. Analysing Memory Leaks with BTrace « ICE09 . playing with java, scala, groovy and spring . Posted by ice09 on July 12, 2009 After having experimented with Eclipse Galileo and the now included Memory Analyzer in the last post, I came across BTrace, which very nicely fits to the tool chain for analyzing Memory Leaks and/or performance problems in applications.
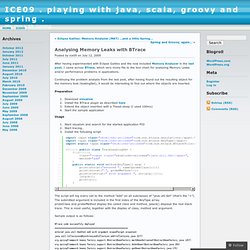
Continuing the problem analysis from the last post, after having found out the resulting object for the memory leak (leakingSet), it would be interesting to find out where the objects are inserted. Preparation Download visualvmInstall the BTrace plugin as described hereExtend the object insertion with a Thead.sleep (I used 100ms) Start the sample application Usage Start visualvm and search for the started application PID Start tracing… Install the following script.