

Public Data Explorer. Top Marginal Tax Rates 1916-2010. Green line is the top marginal rate for married couples filing jointly (most years dividends were tax like ordinary income until 2003), orange is the top rate for income from capital gains.
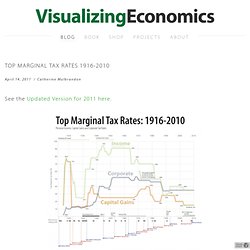
The top corporate tax rate is included for comparison. Your marginal tax rate is the rate you pay on the "last dollar" you earn; but when you view the taxes you paid as a percentage of your income, your effective tax rate is less than your marginal rate, especially after you take into account the deductions and exemptions, i.e. income that is not subject to any tax. America's Economic Myths - David Saied. "The Olympian gods" Nicolas-André Monsiau (1754–1837) Mainstream economists and so-called experts have filled the minds of most Americans with many economic myths that are constantly reinforced by the media and repeated on the streets.
These myths are erroneous at best, sometimes based on half truths. The majority of them are just false. We read and hear them every day: "inflation" is caused by rising oil prices; consumption is the most important element for economic growth; low interest rates are helpful to the economy; government expenditures help "stimulate" the economy; there is an energy "crisis," and many others. Inflation and Energy Myths Inflation — or, rather, the general rise in prices[1] —and the increase in energy prices are issues that have always created numerous economic myths.The following are some of the most common ones. Myth # 1: "Dependence on Foreign Oil" This myth basically suggests that the problem with oil prices is due to America's "dependence" on foreign oil.
Note. US Dollar Exchange Rates - Europe - Current Exchange Rates. Economic and market summary - Prime Super. Economic Outlook. Economic Indicators (IFS) Data Report - IMF eLibrary Data. United States General government revenue (National Currency) data, General government revenue (National Currency) United States. The 2012 Statistical Abstract. What is the Statistical Abstract?
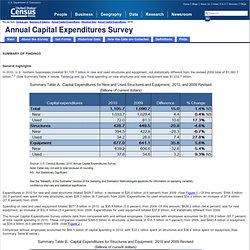
The Statistical Abstract of the United States, published since 1878, is the authoritative and comprehensive summary of statistics on the social, political, and economic organization of the United States. Use the Abstract as a convenient volume for statistical reference, and as a guide to sources of more information both in print and on the Web. Sources of data include the Census Bureau, Bureau of Labor Statistics, Bureau of Economic Analysis, and many other Federal agencies and private organizations. Www.bls.gov/news.release/archives/ximpim_01142010.pdf. Annual Capital Expenditures Historical Data ACES 2010. General highlights In 2010, U.S. nonfarm businesses invested $1,105.7 billion in new and used structures and equipment, not statistically different from the revised 2009 total of $1,090.7 billion.1,2 (See Summary Table A below, Tables1a and 1b.)
Europa World Online : Welcome. This Central Authentication Service (CAS) provides single sign-on access to Pepperdine University web services.

Your log in to this CAS page allows you to access any of your web services for the next two hours, without having to log in again. By logging in via CAS, you agree to abide by the University's Computer and Network Responsible Use Policy. Security warning for shared use computers: The only reliable way to sign out of CAS or other web applications is to exit your web browser. Pepperdine University provides a password management web site at that allows you to change or reset the password associated with your NetworkID. Yearly Average Currency Exchange Rates.
You must express the amounts you report on your U.S. tax return in U.S. dollars.
Therefore, you must translate foreign currency into U.S. dollars if you receive income or pay expenses in a foreign currency. The only exception relates to some qualified business units (QBUs), which are generally allowed to use the currency of a foreign country. The Federal Reserve Bank Discount Window & Payment System Risk Website. SOMA and Liquidity Swaps, Jan 2010. System Open Market Account (SOMA) Recent Developments The SOMA portfolio has continued to expand, although the pace of Federal Reserve purchases of securities under the large-scale asset purchase programs (LSAPs) has slowed compared to its pace last year.
As of December 30, 2009, the Federal Reserve held about $160 billion in agency debt and $908 billion in agency-guaranteed mortgage-backed securities (MBS) under the Federal Open Market Committee's (FOMC's) LSAPs. Background. CLBS Report, System Open Market Account, January 2011. Domestic SOMA Portfolio Recent Developments The SOMA portfolio increased between November 24 and December 29, 2010.
This development is consistent with the FOMC's announcement of its intention to expand its holdings of Treasury securities in the SOMA portfolio by $600 billion by the end of the second quarter of this year. The FRBNY published on January 12, 2011, information on prices paid for securities included in the mid-December 2010 and mid-January 2011 outright Treasury operations. The FRBNY also released the new outright Treasury operation schedule and announced plans to purchase approximately $112 billion in Treasury securities, which represents $80 billion of the announced $600 billion purchase program and $32 billion in purchases associated with principal payments from agency debt and agency MBS, expected to be received between mid-January and mid-February 2011.
Background OMOs can be divided into two types: permanent and temporary. Table 2. Reverse Repos Table 3. Return to top. Federal Taxes At Lowest Rate Since 1950. Bureau of Labor Statistics Data. US Producer Price Index Chart and Data - YCharts. Www.bls.gov/news.release/archives/cpi_01142011.pdf. Www.bls.gov/news.release/archives/cpi_01152010.pdf.