

Declutter Dataviz with Small Multiples. Are you making graphs that look like this crap?
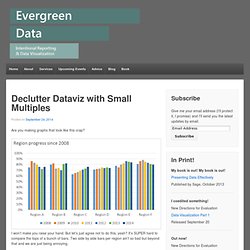
I won’t make you raise your hand. But let’s just agree not to do this, yeah? It’s SUPER hard to compare the tops of a bunch of bars. Two side by side bars per region ain’t so bad but beyond that and we are just being annoying. This is change over time, so a more appropriate graph type would be a line graph, like this: How’s this working for you?
When the graph gets complicated, one good solution is to break it apart into small multiples. Holy smokes, now I can see stuff! The thing is, in the first two graphs, I couldn’t see the data well enough to be able to pull anything meaningful out of it. It’s just six line graphs, guys. Blaisegraphexplorer - Library and software for visualization of graphs and networks. To get started using the GraphExplorer application: Download the latest release (under downloads at left).
The .exe works on windows platforms, and the .jar is an executable that works on all platforms. Double-click the .exe or .jar file to run the application. Select File>>New... to generate a graph and test the software... or Take a look at descriptions of supported GraphFileFormats to see if it will work with your data and select File>>Open... to load it. See the Getting Started Guide for more. Sample Output The following video was created using GraphExplorer and shows the change in a particular attribute of survey data over several months.
The Future Here is another visualization showing what is coming in future releases. The project is built on a variety of custom graphics package, also used in the BlaiseMath project ( 20 Essential Infographics & Data Visualization Blogs. In the tradition of Inspired Mag’s huge lists, here goes a new one – all the blogs with cool data visualization eye candy in the same place! Enjoy and leave some comments with suggestions, questions and so on. Information is Beautiful Visual Compelxity Flowing Data Indexed Cool Infographics Chart Porn EagerEyes Simple Compelxity Data Visualization Well Formed Sankey Diagrams Cartogrammar Wall Stats Accuracy & Aesthetics iGraphics Explained Junk Charts Many Eyes. Designing Style Guidelines For Brands And Websites. Advertisement A website is never done.
Everyone has worked on a project that changed so much after it launched that they no longer wanted it in their portfolio. One way to help those who take over your projects is to produce a style guide. Edward Tufte once said: “Great design is not democratic; it comes from great designers. If the standard is lousy, then develop another standard.” Why Create A Style Guide? You’ll have an easy guide to refer to when handing over the project.Makes you look professional. Branding Guidelines: What To Include? Strategic Brand Overview This should be short and sweet. 1See Kew’s branding guidelines2. Kew uses strong photography in its “brand essence” message, with a few paragraphs that both inspire and define the brand. Logos For print and Web, most brands revolve around the logo. 3See Cunard’s branding guidelines4. Cunard provides many variations on its minimum sizes. 5See Think Brick’s branding guidelines6. Show Examples of What and What Not to Do Spacing Colors.
Courses. Cool Infographics - About. Randy Krum: Randy is the author of the Cool Infographics blog that highlights some of the best examples of data visualizations and infographics found in magazines, newspapers and on the Internet.
The Cool Infographics blog has quickly grown to be one of the top sites in the information design industry. With an average over 7,000 visitors per day and 300,000 page views per month, the site has reached a Google Page Rank of 6/10. In 2009, Randy founded InfoNewt, LLC as the company behind his consulting and infographic design work for clients. Contact me at InfoNewt.com to discuss your project. Cool Infographics, the book was published in October 2013 by Wiley. The Science of InfographicsOnline InfographicsInfographics & SEOInfographic ResumesConfidential Internal InfographcisDesigning InfographicsDesign Resources Infographics presentation at the CIA headquarters Randy is available for Speaking Engagements about infographic topics.
Design Journal - Interview Excerpt. Cover Letter Examples and Guides. Get our free Cover Letter Template — A Word document letter template to get you started writing your cover letter.
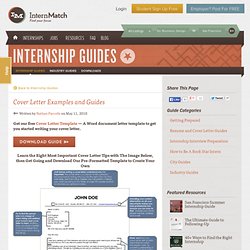
Learn the Eight Most Important Cover Letter Tips with The Image Below, then Get Going and Download Our Pre-Formatted Template to Create Your Own Before writing a cover letter, its important to understand how it can help or hurt you. In the internship application process a cover letter is your first impression. It's an opportunity to tell a perspective employer why you’re the perfect fit for their internship and their office and just as importantly, a cover letter is an opportunity to tell an employer you don't care about their position, by writing a sloppy or template cover letter.
Some valuable cover letter topics include, explaining why a position interests you, what you bring to the table, how you would be a great fit, or something unique about you that makes you different from the hundreds of other candidates. Who is your audience?