
10 Awesome Free Tools To Make Infographics. Advertisement Who can resist a colourful, thoughtful venn diagram anyway?

In terms of blogging success, infographics are far more likely to be shared than your average blog post. This means more eyeballs on your important information, more people rallying for your cause, more backlinks and more visits to your blog. In short, a quality infographic done well could be what your blog needs right now. Designing An Infographic Some great tips for designing infographics: Keep it simple! Ideas for infographic formats include: Timelines;Flow charts;Annotated maps;Graphs;Venn diagrams;Size comparisons;Showing familiar objects or similar size or value. Here are some great tutorials on infographic creation: Creating Your Infographic Plan and research.If required, use free software to create simple graphs and visualisations of data.Use vector graphic software to bring these visualisations into the one graphic.
Free Online Tools For Creating Infographics Stat Planet Hohli Creately New York Times Many Eyes Wordle. Infographics: Here’s How to Make Them Effective. Were petroglyphs man's 1st infographics?

So, what is it with infographics? They’re everywhere these days but like so many shiny new technology toys, we’ve created a monster! I’ve got 10 tips for better infographics, 10 great examples of effective data visuals and 21 best resources to help you find and produce infographics that connect and communicate. Google the term “infographics” and you’ll get more than 5.33 million hits. There are already dozens of excellent infographic blogs including with nearly 10,000 subscribers. In fact, I’m getting so tired of the term I’m just going to call them for a change.
There’s an extensive listing including a history. The use of infographics to communicate complex information simply and quickly picked up momentum in 2005 with the popularity of Digg, Reddit and other social media aggregators. You’ll now find thousands of IG tips on the internet. For all I know, there may even be an IG app, T-shirts, logo’d baseball caps and monogrammed cups.
</b></i>*} WallStats.com The Art of Information. Posted on 23.

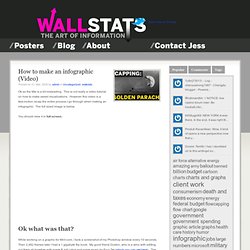
Mar, 2009 by admin in Uncategorized, wallstats Ok so the title is a bit misleading. This is not really a video tutorial on how to make sweet visualizations. However this video is a fast-motion recap the entire process I go through when making an infographic. The full sized image is below. You should view it in full screen, While working on a graphic for Mint.com, I took a screenshot of my Photohop window every 10 seconds.
I generally don’t create infographics with too much planning so there are several points where I just try things out then scrap it. How To Create Outstanding Modern Infographics. In this tutorial you will learn that data doesn't have to be boring, it can be beautiful!

Learn how to use various graph tools, illustration techniques and typography to make an accurate and inspiring infographic in Adobe Illustrator. Start by using the Rectangle Tool (M) to draw a shape. Give it a subtle radial gradient too. The entire design is based on a grid of four columns. To make the columns first select the rectangle and drag a guide onto the centre of the shape. Condense the shape so it fits within the left-most guide and centre guide.
Move the shape over to the right and add another guide to the centre here. Using the Rectangle Tool (M) draw a thin white box on the centre line that will be the width of the gap between the columns. Repeat the process for the other columns with your final result being below. I like to place the most important graphics first and work-in the ancillary charts and graphs afterwards. The Anatomy Of An Infographic: 5 Steps To Create A Powerful Visual. Information is very powerful but for the most bit it is bland and unimaginative.

Infographics channel information in a visually pleasing, instantly understandable manner, making it not only powerful, but extremely beautiful. Once used predominantly to make maps more approachable, scientific charts less daunting and as key learning tools for children, inforgraphics have now permeated all aspects of the modern world. I designed a couple of infographics back in college, the need arising especially around the time Soccer World Cup fever spiked. It was a fun process representing the different groups, predicting winners in each group at each stage and creating a mock pairing of teams that would clash all the way leading upto the finals.
I was a devout Argentinian supporter at the time. Infographics can appear daunting to some with the sheer amount of data they present, but designed in the right manner and step by step, they can actually be one of the most fun things you will ever create.