
Attachments Suck. The Tools that Software Developers Use [Infographic] Professor Oak's Master Plan. What the Angry Birds Look Like after Battling the Pigs [Images] The Angry Birds go into battle looking their finest, but what about after the fighting is done?
![What the Angry Birds Look Like after Battling the Pigs [Images]](http://cdn.pearltrees.com/s/pic/th/angry-birds-battling-images-22522285)
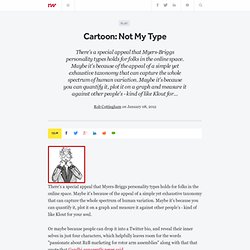
DeviantART user Scooterek answers that question with this fun gallery of battle-weary birds in need of recuperation. You can view the larger versions of the images shown above at the gallery linked below. Early Russian Hydraulic Computer. Infographic: Blizzard's Diablo, Through the Years. As we (hopefully) near the release date for Blizzard's Diablo 3, fanatical fans have compared all the key features within the series' three titles and 15-year history.
Ahh, fresh meat. 112.png (PNG Image, 1000 × 5231 pixels) - Scaled (17%) World Map of All Wars and Conflicts Happening In 2012. Infographic: The Growth of Enterprise Mobility. No industry vertical has been more disrupted by the evolution of the smartphone than the enterprise.

Since Apple released the iPhone in 2007 and the subsequent rise of Android, IT departments have struggled to reconcile device and application management, security and software deployment. What to do when every employee wants to bring their own device to work? An infographic from xcube puts the changing enterprise mobile landscape into perspective. For instance, 63% of enterprises look to mobility for cost savings and near 50% are responding to employee demand. Since the end of the third quarter in 2011, the iPhone is the most preferred smartphone in the enterprise at 45%. Brands are flocking to apps. Business apps were the fastest growing section in the Apple App Store from 2009 to 2010, up 186%.
The Top Ten Features of Windows 8 [Infographic] Meet Mr. Android - An Example Of A Typical Android User [INFOGRAPHIC. Advertisements Can you imagine a world where we could create a living version of both a typical iOS and Android user then pit them against each in various tasks to find out once and for all which the is the best operating system?

Yeah, that would be pretty sensational, but unfortunately it isn’t going to happen, not anytime soon anyway. Cartoon: Not My Type. There's a special appeal that Myers-Briggs personality types holds for folks in the online space.
Maybe it's because of the appeal of a simple yet exhaustive taxonomy that can capture the whole spectrum of human variation. Maybe it's because you can quantify it, plot it on a graph and measure it against other people's - kind of like Klout for your soul. Or maybe because people can drop it into a Twitter bio, and reveal their inner selves in just four characters, which helpfully leaves room for the words "passionate about B2B marketing for rotor arm assemblies" along with that that quote that Gandhi apparently never said.
Whatever the reason, it at least suggests that in a world so often dominated by metrics and conversions, we're still up for a little introspection. Why Yes, You Can Mirror Polish a DeLorean. Infographic: The Changing TV Landscape. The Truth About Battery Meters [Humorous Image] Mars_vertical_full.jpg (JPEG Image, 800x15899 pixels) Batman-infographic.jpg (JPEG Image, 1174x4281 pixels) - Scaled (21%) Every Significant Batsuit Ever [Infographic] Think you are familiar with all of the variations of Batman’s batsuit? Then test your knowledge versus this comprehensive chart showing the significant versions from comics, movies, TV, video games, and theater since Batman’s debut in 1939. This is only a small section from the chart, so browse on over to see the rest on the full-size version linked below. View the Full-Size Chart (Very Large) Google and Memory [Infographic] You can Never Have too Many Toolbars! [Humorous Image] Infographic: Firefox Had Need for Speed in 2011.
Mozilla today released an infographic that charts its accomplishments over the year, including a hefty speed boost.

Mozilla this week released a speedier version of Firefox—version 9. But the browser is not the only thing that Mozilla sped up this year; it also adopted a Chrome-like rapid release cycle that resulted in five major browser releases in about nine months. Mozilla today released an infographic that charts its accomplishments over the year, including a hefty speed boost. Firefox 9, released last night, is seven times faster than Firefox 3.6, which was released in January 2010, and 32 times faster than the first iteration of the Firefox browser. The revamped Firefox also uses up to 50 percent less memory, Mozilla said. 5 MB Hard-Drive from 1956 [Images]
The Internet Justice League: Internet Sites Recast As Super Heroes. What would Google, Facebook, Reddit, and other popular internet sites look like envisioned as super heroes (and villains)?

Read on to see their powers and arch enemies. CollegeHumor shares a collection of super heroes and villains inspired by popular websites. Their collection includes Google, Facebook, Reddit, Huffington Post, Amazon, and more. Hit up the link below to check them out and then sound off in the comments with your own take on what kind of super hero/villain your favorite web sites would be. Sshot4ee06a9714ee3.jpg (JPEG Image, 650x500 pixels)