
Infographics & Data Visualization. Free online mind mapping software. Piktochart: Infographic and Presentation Tool for Non-Designers. Piktochart - Infographic Maker. Icon Archive - Search 418,049 free icons, desktop icons, download icons, social icons, xp icons, vista icons. Create and share visual ideas online. Infographics & Data Visualization. Juice Labs - Chart Chooser. Themes For A Good Infographic. Chronology of NASA Missions by Carlos Gámez from Lainformacion Information graphics give us new ways to understand and think about information.
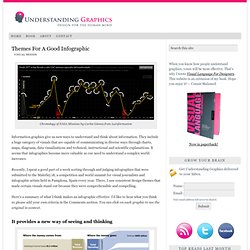
They include a huge category of visuals that are capable of communicating in diverse ways through charts, maps, diagrams, data visualizations and technical, instructional and scientific explanations. It seems that infographics become more valuable as our need to understand a complex world increases. Recently, I spent a good part of a week sorting through and judging infographics that were submitted to the Malofiej 18, a competition and world summit for visual journalists and infographic artists held in Pamplona, Spain every year. 10 Tips for Designing Infographics. Assuming you’re not working for a media corporation with huge graphics and statistics departments at your disposal, you may want to create some infographics for your own articles.
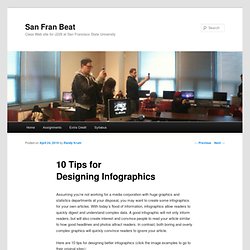
With today’s flood of information, infographics allow readers to quickly digest and understand complex data. A good infographic will not only inform readers, but will also create interest and convince people to read your article similar to how good headlines and photos attract readers. In contrast, both boring and overly complex graphics will quickly convince readers to ignore your article. Here are 10 tips for designing better infographics (click the image examples to go to their original sites):