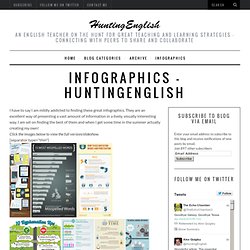

Infographics: Growing Up With Technology. Infographics. I have to say I am mildly addicted to finding these great infographics.

They are an excellent way of presenting a vast amount of information in a lively, visually interesting way. I am set on finding the best of them and when I get some time in the summer actually creating my own! Click the images below to view the full version/slideshow. [separator type="thin"] Student Designed Infographics: Process & Products. Last year my students designed infographics for the first time.

I enjoyed the process and the products. It was a fun strategy to teach my students crucial research skills while encouraging them to think creatively about how to visually communicate information. This year I was literally blown away by the work my students did on their infographics. I wanted to share my process and examples of student work to help support other teachers. Step 1: Submit a Proposal Students were encouraged to select a topic that interested them.
Step 2: Research, Research & Research Some More! After every student received feedback on their proposal, we began the research component. Step 3: Evaluate the Credibility of Digital Sources My students had to complete my “Got Credibility?” I also required that students use their Diigo accounts to annotate their online resources and share them with me via email. Step 4: Explore Infographic Tools Easel.ly Piktochart Infogr.am Step 5: Check Out Infographics. Coolcatteacher.sharedby.co/share/a7tpfL. Create Infographics With Piktochart. It seems like every day I find a new infographic on at least one of the blogs that I follow.

This is because a good infographic can deliver a lot of information in an easy-to-understand format. If you would like to have your students try their hands at creating infographics, Piktochart is a good tool to use. Piktochart provides seven free infographic templates. Each template can be customized by changing the colors, fonts, icons, and charts on each template. If you need more space on the template, you can add more fields at the bottom of the templates. Infographics for Secondary Classrooms. Infographics & Data Visualization. Piktochart- Infographic & Presentation Tool.
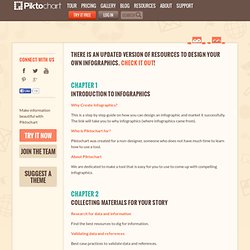
Alltop - Top Infographics News. Infographics Lesson Plans. Infographics and-the-classroom. Create Your Own Info Graphic. There is an updated version of resources to design your own infographics.

Check it out! Introduction to Infographics Why Create Infographics? This is a step by step guide on how you can design an infographic and market it successfully. The link will take you to why infographics (where infographics came from). Who is Piktochart for? Piktochart was created for a non-designer, someone who does not have much time to learn how to use a tool. About Piktochart We are dedicated to make a tool that is easy for you to use to come up with compelling infographics. Collecting materials for your story Research for data and information Find the best resources to dig for information. Validating data and references Best case practices to validate data and references. Structuring a story How to go about crafting a story to make your data compelling. Selecting a design/designer Some guidelines to help you select a design/designer based on budget. Creating your own infographic Set up your infographic in under 5 minutes.
Infographics & Data Visualization. Make Information Beautiful - Login. Create and share visual ideas online.