
Installer Python 3 [Site personnel d'Olivier Leguay] Didier Müller. ISN et 130 exercices en Python Terminale S. Python pour jeunes débutants de 7 à 97 ans. Lesson 1: Graphing with Matplotlib - Lesson Plan - Visualising Sorting with Python. This lesson will introduce students to visualising data by using Python's matplotlib library.
In order for the students to follow this lesson, they will need to use computers with Python 3 and matplotlib installed. Installing matplotlib To install matplotlib, follow the instructions below. Linux (Debian-based distro) Open a Terminal windowRun the command sudo apt-get install python3-matplotlib Mac OS X and Windows Install with pip using the command pip3 install matplotlibAlternatively, install from the matplotlib website Learning objectives To understand how to use a simple list comprehension to create a random list of numbersTo be able to produce simple graphs using matplotlib Learning outcomes All students are able to Use a list comprehension to produce a random list of numbersPlot a simple scatter graph using matplotlib Most students are able to Plot a variety of different graphs using matplotlibPlot an interactive graph using matplotlib Some students are able to Lesson summary Starter Plenary.
Tracer les courbes — Bien démarrer avec Numpy/Scipy/Matplotlib valpha documentation. Le module Matplotlib est chargé de tracer les courbes: >>> import matplotlib.pyplot as plt D’une manière générale les fonctions plt.plot attendent des vecteur/matrice, bref des tableaux de points du plan.
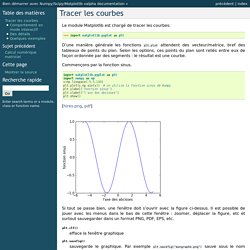
Selon les options, ces points du plan sont reliés entre eux de façon ordonnée par des segments : le résultat est une courbe. Commençons par la fonction sinus. import matplotlib.pyplot as pltimport numpy as npx=np.linspace(-5,5,100)plt.plot(x,np.sin(x)) # on utilise la fonction sinus de Numpyplt.ylabel('fonction sinus')plt.xlabel("l'axe des abcisses")plt.show() [hires.png, pdf] Si tout se passe bien, une fenêtre doit s’ouvrir avec la figure ci-dessus.
Pyplot tutorial — Matplotlib 1.5.1 documentation. Matplotlib.pyplot is a collection of command style functions that make matplotlib work like MATLAB.
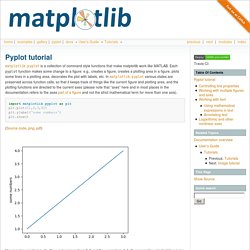
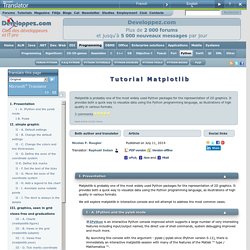
Each pyplot function makes some change to a figure: e.g., creates a figure, creates a plotting area in a figure, plots some lines in a plotting area, decorates the plot with labels, etc. In matplotlib.pyplot various states are preserved across function calls, so that it keeps track of things like the current figure and plotting area, and the plotting functions are directed to the current axes (please note that “axes” here and in most places in the documentation refers to the axespart of a figure and not the strict mathematical term for more than one axis). import matplotlib.pyplot as pltplt.plot([1,2,3,4])plt.ylabel('some numbers')plt.show() (Source code, png, pdf) You may be wondering why the x-axis ranges from 0-3 and the y-axis from 1-4. Plot() is a versatile command, and will take an arbitrary number of arguments. Plt.plot([1, 2, 3, 4], [1, 4, 9, 16]) (Source code, png, pdf) Tutoriel Matplotlib.
Matplotlib is probably one of the most widely used Python packages for the representation of 2D graphics.
It provides both a quick way to visualize data using the Python programming language, as illustrations of high quality in various formats. We will explore matplotlib in interactive console and will attempt to address the most common cases. I - A. IPython and the pylab mode▲ IPython is an interactive Python console improved which supports a large number of very interesting features including input/output named, the direct use of shell commands, system debugging improved and much more. By launching this console with the argument - pylab (-pylab since IPython version 0.12), there is immediately an interactive matplotlib session with many of the features of the Matlab ™ type / Mathematica ™.
I B. Pylab provides a procedural interface to the library matplotlib-oriented object graph. In this topic, we would like to draw the functions sine and cosine on a single chart.