
分别使用wxPython与PyQt显示Mapnik的渲染结果出现问题 OSGeo中国中心 开放地理空间实验室. [Mapnik-users] Simple PyQt4 Application with Mapnik without PyQGIS (QGIS API) Noli, Right, zsj's script is what you want - its fun and works quite well.
![[Mapnik-users] Simple PyQt4 Application with Mapnik without PyQGIS (QGIS API)](http://cdn.pearltrees.com/s/pic/th/mapnik-application-without-126146039)
But to make it work you need to launch and application process (like QGIS does) and attach the widget. I've placed the code here for you to get at: On Jul 22, 2010, at 7:42 PM, Noli Sicad wrote: > Hi, > > I have been looking for simple application in python i..e. PyQt that > has map canvas to render shapefile or spatialite.
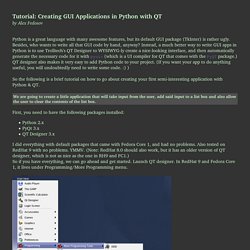
Building a Matplotlib GUI with Qt Designer: Part 1. Designer is a graphical tool for building complex Qt4 GUI applications.
In this post, I will use Designer to construct a simple GUI application, and in the following posts, I’ll use Python, matplotlib, and PyQt4 to add the necessary application logic to display an interactive data plot and a plot selection list. The final result is shown below. PyQT Tutorial. Tutorial: Creating GUI Applications in Python with QTby Alex Fedosov Python is a great language with many awesome features, but its default GUI package (TkInter) is rather ugly.
Besides, who wants to write all that GUI code by hand, anyway? Instead, a much better way to write GUI apps in Python is to use Trolltech's QT Designer to WYSIWYG-ly create a nice-looking interface, and then automatically generate the necessary code for it with pyuic (which is a UI compiler for QT that comes with the PyQT package.) QT designer also makes it very easy to add Python code to your project. (If you want your app to do anything useful, you will undoubtedly need to write some code. :) ) So the following is a brief tutorial on how to go about creating your first semi-interesting application with Python & QT. First, you need to have the following packages installed: Events and signals in PyQt4. In this part of the PyQt4 programming tutorial, we will explore events and signals occurring in applications.
Events All GUI applications are event-driven. Events are generated mainly by the user of an application. But they can be generated by other means as well: e.g. an Internet connection, a window manager, or a timer. When we call the application's exec_() method, the application enters the main loop. In the event model, there are three participants: event source event object event target The event source is the object whose state changes. PyQt4 has a unique signal and slot mechanism to deal with events. New API. PyQt : concevoir visuellement des interfaces avec Qt Designer. Heureusement, Qt fournit un outil pour concevoir des interfaces et en faire du code utilisable automatiquement.
Cet outil s'appelle Qt Designer et il est installé en même temps que le bundle Qt. En plus, on a besoin d'un convertisseur pour le XML des fichiers .ui du designer en fichiers Python, il a été installé avec PyQt4. Ainsi, pour concevoir des interfaces pour PyQt, les outils suivants sont nécessaires : Qt Designer, de Nokia ; pyuic4, de Riverbank.
L'interface pourrait sembler familière à ceux qui ont déjà utilisé Visual Studio, Glade ou d'autres outils du même genre. Welcome to the Matplotlib Basemap Toolkit documentation! — Basemap Matplotlib Toolkit 1.0.8 documentation. PyQtGraph - Scientific Graphics and GUI Library for Python. Python Programming Tutorials. Setting up the map — Basemap Matplotlib Toolkit 1.0.8 documentation. In order to represent the curved surface of the earth on a two-dimensional map, a map projection is needed.
Since this cannot be done without distortion, there are many map projections, each with it’s own advantages and disadvantages. Basemap provides 24 different map projections. Some are global, some can only represent a portion of the globe. When a Basemap class instance is created, the desired map projection must be specified, along with information about the portion of the earth’s surface that the map projection will describe. There are two basic ways of doing this. The class variable supported_projections is a dictionary containing information about all the projections supported by Basemap.
Python Programming Tutorials. In this Matplotlib tutorial, we're going to be covering the geographic plotting module, Basemap.
Basemap is an extension to Matplotlib. In order to use Basemap, we first need it. To get Basemap, you can either get it from here: or you can go to If you are having trouble installing Basemap, check out the pip installation tutorial. Python Programming Tutorials. In this Matplotlib tutorial, we're going to be going over custom legends.
We've covered the basics of adding a legend already. The main issue with legends is typically that the legend gets in the way of data. There are a few options here. One option is to put the legend outside of the axis, but we have multiple subplots here and that would be pretty difficult. Instead, we'll make the legend a bit smaller, and then apply an alpha to it. Building a Matplotlib GUI with Qt Designer: Part 1.