
Use “Finish this image” exercises to improve visual literacy. Overview It is important when using visual sources to help students think more carefully about the devices used by cartoonists, artists and photographers to get their message across.
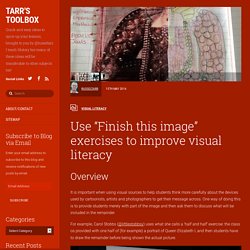
One way of doing this is to provide students merely with part of the image and then ask them to discuss what will be included in the remainder. For example, Carol Stobbs (@littlestobbsy) uses what she calls a ‘half and half’ exercise: the class os provided with one half of (for example) a portrait of Queen Elizabeth I, and then students have to draw the remainder before being shown the actual picture.
Taking it further The same approach can be adopted with political cartoons. If you want to see the complete cartoon, Google ‘What, no chair for me?’ Links to other activities This exercise could be followed by a ‘design your own cartoon’ exercise, or by further analyis of picture sources using the source overlay template and the use of speech bubbles onto image sources. Like this: Like Loading... Related Image Wipe. 10 Creative Strategies for Teaching Chronological Narratives.
Overview At the start of a new topic in a subject like history, it’s often necessary to familiarise students with an essential chronology of events before analysing this in terms of key questions.
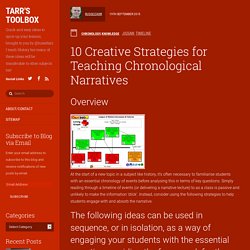
Simply reading through a timeline of events (or delivering a narrative lecture) to as a class is passive and unlikely to make the information ‘stick’. Instead, consider using the following strategies to help students engage with and absorb the narrative. The following ideas can be used in sequence, or in isolation, as a way of engaging your students with the essential narrative providing the framework for the study topic. Idea 1. This strategy is the subject of a dedicated blog post here and is a great way of getting students running around and feverishly making hand-written notes on the key events in a timeline prior to further development. Idea 2. The Running Dictation is less effective for detailed stories which take place over many years.
Idea 4. Idea 5. Idea 6. Idea 7. Idea 9. Idea 10. Target Diagrams for Categorisation. The ClassTools Target Diagram Generator is a fantastic way of getting students to break down a key question.
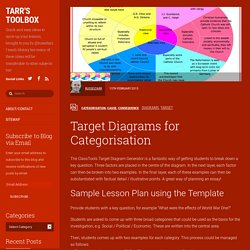
Three factors are placed in the centre of the diagram. In the next layer, each factor can then be broken into two examples. In the final layer, each of these examples can then be substantiated with factual detail / illustrative points. A great way of planning an essay! Sample Lesson Plan using the Template Provide students with a key question, for example “What were the effects of World War One?” Students are asked to come up with three broad categories that could be used as the basis for the investigation, e.g. Then, students comes up with two examples for each category.
Sticky-notes and project nests: collaborate, collate, categorise, connect. At the recent Practical Pedagogies Conference here at the International School of Toulouse, Ewan Mcintosh of NoTosh outlined the success schools have had in using ‘project nests’ to gather, inspire and organise ideas (see his blogpost here).
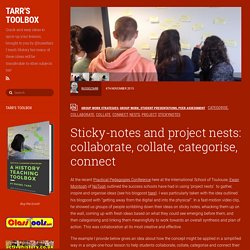
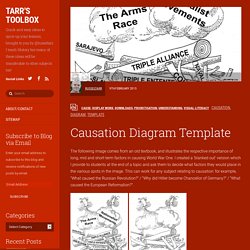
I was particularly taken with the idea outlined his blogpost with “getting away from the digital and into the physical”. In a fast-motion video clip, he showed us groups of people scribbling down their ideas on sticky notes, whacking them up on the wall, coming up with fresh ideas based on what they could see emerging before them, and then categorising and linking them meaningfully to work towards an overall synthesis and plan of action. This was collaboration at its most creative and effective. Case Study – Why do countries turn into dictatorships? Causation Diagram Template. The following image comes from an old textbook, and illustrates the respective importance of long, mid and short-term factors in causing World War One.
3 Creative Ways to Use “Jigsaw” Groups. The Jigsaw Group technique is one that I use a lot to ensure that students work efficiently with each other on research projects and report back with their findings in a creative way.
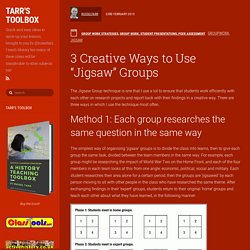
There are three ways in which I use the technique most often. Home page. TipLine - Gates' Computer Tips: Linking to a specific spot in youtube video. In the last post I needed to link to a specific spot in a youtube video.
I knew that I had seen it done before but I didn't recall where or how it was done. Of course, a quick search (no, not on wolframAlpha) lead me to several posts that explained how to do just that. You simply locate the spot in the video where you'd like to begin, in this case it's at 1 minute and ten seconds into the clip, and turn it into this format: #t=01m10 and then append that the url. Tarr's Toolbox. Timeline tools and resources.
Civil Rights America 20th Century. Everything Indexed. Industrial Revolution. For Teachers & Advisers : Resources for Teachers and HE Advisers. Online.clickview.co. Guardian Teacher Network. Russia (A2: 1855-1964) 20th century. English Civil War. General. Tudors. Nazi Germany. British (General) WWI. Cold War. WWII. Winston Churchill. American Civil War.