
Data-Ink Ratio. [edit] Definitions The Data-Ink ratio is a concept introduced by Edward Tufte, the expert whose work has contributed significantly to designing effective data presentations.
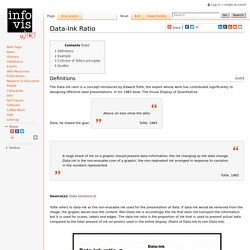
In his 1983 book, The Visual Display of Quantitative. Sometimes_we_must_raise_our_voices. The Work of Edward Tufte and Graphics Press. Edward Tufte is a statistician and artist, and Professor Emeritus of Political Science, Statistics, and Computer Science at Yale University.
He wrote, designed, and self-published 4 classic books on data visualization. The New York Times described ET as the "Leonardo da Vinci of data," and Business Week as the "Galileo of graphics. " He is now writing a book/film The Thinking Eye and constructing a 234-acre tree farm and sculpture park in northwest Connecticut, which will show his artworks and remain open space in perpetuity. He founded Graphics Press, ET Modern gallery/studio, and Hogpen Hill Farms LLC. Visual Display of Quantitative Information 200 pages.