
Fathom. Data Visualization, Infographics, and Statistics. Phd/dissertation-110323c.pdf. Rise of the Data Scientist. As we've all read by now, Google's chief economist Hal Varian commented in January that the next sexy job in the next 10 years would be statisticians.
Obviously, I whole-heartedly agree. Tom Mitchell's Home Page. E.
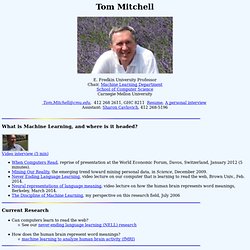
Fredkin University Professor Chair, Machine Learning Department School of Computer Science Carnegie Mellon University Tom.Mitchell@cmu.edu, 412 268 2611, GHC 8211 Resume, A personal interview Assistant: Sharon Cavlovich, 412 268-5196 What is Machine Learning, and where is it headed? Business Analytics/Business Intelligence information, news and tips - SearchBusinessAnalytics.com. San Francisco startup make data science a sport. SAN FRANCISCO (AP) — Strange secrets hide in numbers.
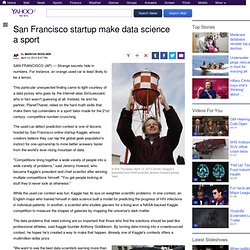
For instance, an orange used car is least likely to be a lemon. This particular unexpected finding came to light courtesy of a data jockey who goes by the Internet alias SirGuessalot, who in fact wasn't guessing at all. Instead, he and his partner, PlanetThanet, relied on the hard math skills that make them top contenders in a sport tailor-made for the 21st century: competitive number-crunching. The used car defect prediction contest is one of dozens hosted by San Francisco online startup Kaggle, whose creators believe they can tap the global geek population's instinct for one-upmanship to mine better answers faster from the world's ever-rising mountain of data.
"Competitions bring together a wide variety of people into a wide variety of problems," said Jeremy Howard, who became Kaggle's president and chief scientist after winning multiple competitions himself. View gallery "Crowdsourcing allows you to squeeze data dry," Goldbloom said. What is a data scientist? Everybody loves a data scientist: ever since Google's Hal Varian told the world that the sexy job in the next ten years will be statisticians.
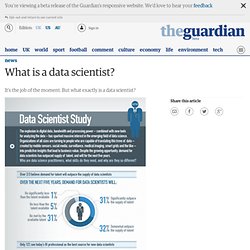
People think I'm joking, but who would've guessed that computer engineers would've been the sexy job of the 1990s? That, combined with the McKinsey report into big data last year is a powerful blend. The report reckoned the US alone would need 190,000 deep analytical 'data scientists' - and another 1.5m data-savvy managers to make the big decisions. Www.kdnuggets.com//gpspubs/aimag-kdd-overview-1996-Fayyad.pdf.
O'Reilly Radar - Insight, analysis, and research about emerging technologies. What is data science? We’ve all heard it: according to Hal Varian, statistics is the next sexy job.
Five years ago, in What is Web 2.0, Tim O’Reilly said that “data is the next Intel Inside.” But what does that statement mean? Why do we suddenly care about statistics and about data? In this post, I examine the many sides of data science — the technologies, the companies and the unique skill sets. Blog « Dataspora. Cambridge, Mass. – March 4, 2011 – Via Science announced the acquisition of Dataspora, a predictive analytics firm that helps companies solve complex big data problems.

The acquisition helps strengthen Via Science’s positioning to support the consumer packaged goods and retail sectors, areas of focus for Dataspora. REFS™ provides the ability to leverage causal mathematics at scale with its supercomputing platform. This allows decision-makers to make better use of data with mathematical models that can diagnose problems or predict future outcomes. Via Science has invested over 10 years and $25 million to prove the value of REFS™ in high-stakes problem areas such as precision medicine and quantitative trading. Dataspora has experience leveraging predictive analytics in numerous industry verticals.
Via Science has integrated the knowledge acquired, and will continue to target the core sectors Dataspora pioneered. The Three Sexy Skills of Data Geeks « Dataspora. The Data Science Venn Diagram. Posted: September 30th, 2010 | Author: drewconway | Filed under: Philosophy of Data | Tags: data, data science, visualization | 9 Comments by Drew Conway Last Monday I—humbly—joined a group of NYC’s most sophisticated thinkers on all things data for a half-day unconference to help O’Reily organize their upcoming Strata conference.
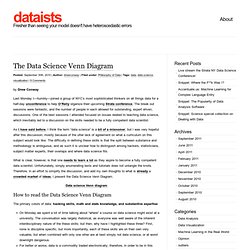
The break out sessions were fantastic, and the number of people in each allowed for outstanding, expert driven, discussions. One of the best sessions I attended focused on issues related to teaching data science, which inevitably led to a discussion on the skills needed to be a fully competent data scientist. Career Advice: How do I become a data scientist. Data Visualization. The Week In Data. Inbetween projects for clients, the guys at the Stamen studio of design and technology in California have been indulging their passion for mapping.
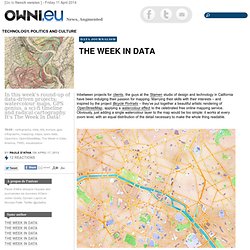
Marrying their skills with their interests – and inspired by the project Bicycle Portraits – they’ve put together a beautiful artistic rendering of OpenStreetMap, applying a watercolour effect to the celebrated free online mapping service. Obviously, just adding a single watercolour layer to the map would be too simple: it works at every zoom level, with an equal distribution of the detail necessary to make the whole thing readable.
‘Dans quel état j’erre’ Aaron Parecki revealed his passion for geography through his series of coloured maps.