

Logistic Regression. Preliminaries Model Formulae You will need to know a bit about Model Formulae to understand this tutorial.
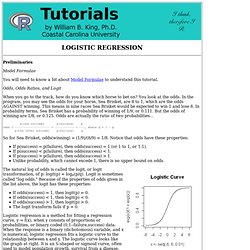
Odds, Odds Ratios, and Logit When you go to the track, how do you know which horse to bet on? You look at the odds. P(one outcome) p(success) p odds = -------------------- = ----------- = ---, where q = 1 - p p(the other outcome) p(failure) q So for Sea Brisket, odds(winning) = (1/9)/(8/9) = 1/8. The natural log of odds is called the logit, or logit transformation, of p: logit(p) = loge(p/q). If odds(success) = 1, then logit(p) = 0. Logistic regression is a method for fitting a regression curve, y = f(x), when y consists of proportions or probabilities, or binary coded (0,1--failure,success) data.
Y = [exp(b0 + b1x)] / [1 + exp(b0 + b1x)] Logistic regression fits b0 and b1, the regression coefficients (which were 0 and 1, respectively, for the graph above). Model Formulae. This is a short tutorial on writing model formulae for ANOVA and regression analyses.
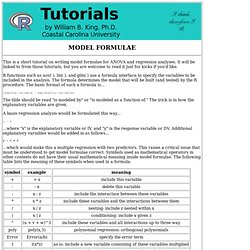
It will be linked to from those tutorials, but you are welcome to read it just for kicks if you'd like. R functions such as aov( ), lm( ), and glm( ) use a formula interface to specify the variables to be included in the analysis. Regression with SPSS: Lesson 3 - Regression with Categorical Predictors. We can test the overall interaction with the test command.
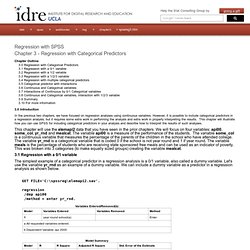
This interaction effect is not significant, with an F of 1.116 and a p value of .329. It is important to note how the meaning of the coefficients change in the presence of these interaction terms. For example, in the prior model, with only main effects, we could interpret Byr_rnd as the difference between the year-round and non- year-round students. However, now that we have added the interaction term, the term Byr_rnd represents the difference between cell3 and cell6, or the difference between the year- round and non-year round students when mealcat=3 (because mealcat=3 was the omitted group). Regression: Statnotes, from North Carolina State University. This content is now available from Statistical Associates Publishers.
Click here . Below is the unformatted overview and table of contents. Overview Multiple regression, a time-honored technique going back to Pearson's use of it in 1908, is employed to account for (predict) the variance in an interval dependent variable, based on linear combinations of interval, dichotomous, or dummy independent variables. Often called OLS regression because of its reliance on ordinary least squares estimation, multiple regression can establish whether a set of independent variables explains a proportion of the variance in a dependent variable at a significant level (through a significance test of R2), and can establish the relative predictive importance of the independent variables (by comparing beta weights).
Power terms can be added as independent variables to explore curvilinear effects. DSS - Interpreting Regression Output. Home Online Help Analysis Interpreting Regression Output Introduction This guide assumes that you have at least a little familiarity with the concepts of linear multiple regression, and are capable of performing a regression in some software package such as Stata, SPSS or Excel.
Brief review of regression Remember that regression analysis is used to produce an equation that will predict a dependent variable using one or more independent variables. Y = b1X1 + b2X2 + ... + A where Y is the dependent variable you are trying to predict, X1, X2 and so on are the independent variables you are using to predict it, b1, b2 and so on are the coefficients or multipliers that describe the size of the effect the independent variables are having on your dependent variable Y, and A is the value Y is predicted to have when all the independent variables are equal to zero.
P, t and standard error The t statistic is the coefficient divided by its standard error. How large is large? Coefficients Further Reading. Pca - Can principal component analysis be applied to datasets containing a mix of continuous and categorical variables? - Statistical Analysis - Stack Exchange. (ML 4.1) Maximum Likelihood Estimation (MLE) (part 1) Akaike information criterion. The Akaike information criterion (AIC) is a measure of the relative quality of a statistical model, for a given set of data.
As such, AIC provides a means for model selection. Basic Statistics. Descriptive Statistics "True" Mean and Confidence Interval.
Probably the most often used descriptive statistic is the mean. The mean is a particularly informative measure of the "central tendency" of the variable if it is reported along with its confidence intervals. As mentioned earlier, usually we are interested in statistics (such as the mean) from our sample only to the extent to which they can infer information about the population.