
QuantBros.com Introduction to R Programming for Financial Timeseries. Using quantmod package in R to retrieve Financial Time Series data from Yahoo and Google sources. Clean Your Data in Seconds with This R Function. All data needs to be clean before you can explore and create models.
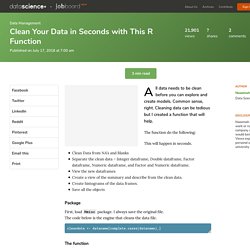
Common sense, right. Cleaning data can be tedious but I created a function that will help. The function do the following: Clean Data from NA’s and BlanksSeparate the clean data – Integer dataframe, Double dataframe, Factor dataframe, Numeric dataframe, and Factor and Numeric dataframe.View the new dataframesCreate a view of the summary and describe from the clean data.Create histograms of the data frames.Save all the objects This will happen in seconds. Package First, load Hmisc package. Cleandata <- dataname[complete.cases(dataname),] The function The function is below. Cleanme <- function(dataname){ #SAVE THE ORIGINAL FILE oldfile <- write.csv(dataname, file = "oldfile.csv", row.names = FALSE, na = "") #CLEAN THE FILE. Researcher Requests for Inappropriate Analysis and Reporting. Inappropriate Statistical Analysis and Reporting in Medical Research. The 5 Basic Statistics Concepts Data Scientists Need to Know. Google Maps.
Practical Machine Learning with R and Python – Part 4. This is the 4th installment of my ‘Practical Machine Learning with R and Python’ series.
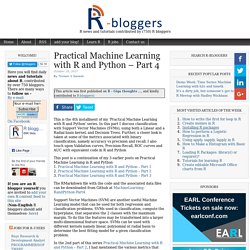
In this part I discuss classification with Support Vector Machines (SVMs), using both a Linear and a Radial basis kernel, and Decision Trees. Further, a closer look is taken at some of the metrics associated with binary classification, namely accuracy vs precision and recall. Timeseries plotting example in R. Plotting Time Series in R using Yahoo Finance data (Revolutions) By Joseph Rickert I recently rediscovered the Timely Portfolio post on R Financial Time Series Plotting.
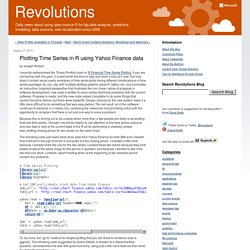
If you are not familiar with this gem, it is well-worth the time to stop and have a look at it now. Not only does it contain some useful examples of time series plots mixing different combinations of time series packages (ts, zoo, xts) with multiple plotting systems (base R, lattice, etc.) but it provides an instructive, historical perspective that illustrates the non linear nature of progress in software development: new code is written to solve certain technical problems with the current software.
Progress is made, and the new code makes it possible to do some things that couldn't be done before, but there were tradeoffs. R Financial Time Series Plotting. As with all of R, the ability to easily chart financial time series is the result of an iterative progression driven by the collaboration of an extremely dedicated group of open source volunteers.
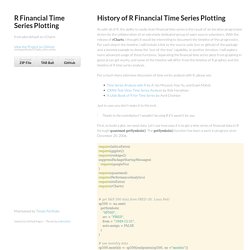
With the release of rCharts, I thought it would be interesting to document the timeline of this progression. For each step in the timeline, I will include a link to the source code (svn or github) of the package and a minimal example to demo the "out-of-the-box" capability. In another iteration, I will explore more advanced usage of these functions. Time Series Analysis in R Part 3: Getting Data from Quandl. This is part 3 of a multi-part guide on working with time series data in R.
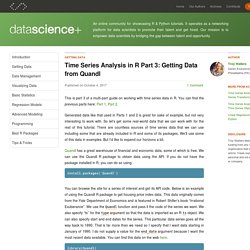
You can find the previous parts here: Part 1, Part 2. Generated data like that used in Parts 1 and 2 is great for sake of example, but not very interesting to work with. So let’s get some real-world data that we can work with for the rest of this tutorial. Time Series Analysis in R Part 3: Getting Data from Quandl. This is part 3 of a multi-part guide on working with time series data in R.
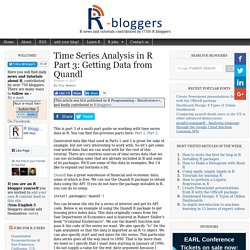
You can find the previous parts here: Part 1, Part 2. Analyzing Google Trends Data in R. Google Trends shows the changes in the popularity of search terms over a given time (i.e., number of hits over time).
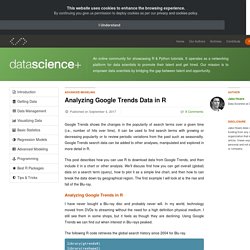
It can be used to find search terms with growing or decreasing popularity or to review periodic variations from the past such as seasonality. An amazing journey in Data Science and Machine Learning. Attended the EARL (Enterprise Applications of the R Language) 2017 Conference in London this September (12th - 14th September) and, I had the opportunity to be a participant in the “Writing functions for Fun and Profit” workshop by Jenny Bryan (RStudio).
“With Jenny Bryan If there’s a bit of R code that you copy and paste repeatedly, package it in a function! User-written functions are a great way to increase your effectiveness in many contexts: scripts, R Markdown documents, R notebooks, Shiny apps, and, of course, R packages. Compared with highly repetitive code, functions can increase code quality, while also reducing programmer aggravation. Many principles of design and process work well across all those domains. This workshop should be useful to those new to writing functions, as well as those more experienced, e.g., ready to start writing packages. It was a great experience with some interesting learnings and insights that I have tried to capture in the notes below. R - Difference between density and probability - Cross Validated. Tableau. Skip to main content Webinar Series Advanced Analytics for Hardcore Data People Share At Tableau we help people see and understand data.
Seven words that shape everything we do. In this webinar series, we explore how Tableau’s intuitive interface, powerful back end, and statistical integrations provide a strong base for any advanced analytics infrastructure. Join us to learn more about our advanced analytics capabilities and get your questions answered in real time. Live Webinars. An Introduction to Stock Market Data Analysis with R (Part 1) Around September of 2016 I wrote two articles on using Python for accessing, visualizing, and evaluating trading strategies (see part 1 and part 2).
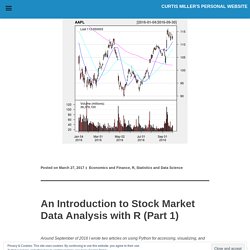
These have been my most popular posts, up until I published my article on learning programming languages (featuring my dad’s story as a programmer), and has been translated into both Russian (which used to be on backtest.ru at a link that now appears to no longer work) and Chinese (here and here). R has excellent packages for analyzing stock data, so I feel there should be a “translation” of the post for using R for stock data analysis. This post is the first in a two-part series on stock data analysis using R, based on a lecture I gave on the subject for MATH 3900 (Data Science) at the University of Utah. In these posts, I will discuss basics such as obtaining the data from Yahoo! Finance using pandas, visualizing stock data, moving averages, developing a moving-average crossover strategy, backtesting, and benchmarking.
TradeAnalytics: R Development Page. Below is a list of all packages provided by project TradeAnalytics. Important note for package binaries: R-Forge provides these binaries only for the most recent version of R, but not for older versions. In order to successfully install the packages provided on R-Forge, you have to switch to the most recent version of R or, alternatively, install from the package sources (.tar.gz). Build status codes. R Financial Time Series Plotting. Plotting Time Series in R using Yahoo Finance data. An Introduction to Stock Market Data Analysis with R (Part 2) Around September of 2016 I wrote two articles on using Python for accessing, visualizing, and evaluating trading strategies (see part 1 and part 2). These have been my most popular posts, up until I published my article on learning programming languages (featuring my dad’s story as a programmer), and has been translated into both Russian (which used to be on backtest.ru at a link that now appears to no longer work) and Chinese (here and here).
ProRealTime Trading - Trading Software for Futures, Forex & Stocks. How to Install Quantstrat – Become Great at R. Quantstrat is a R package. It makes backtesting trading strategies easy. It is still under heavy development and can’t be installed from CRAN yet. You can install it from source and the process is straightforward. Step1. Install these dependencies in R: install.packages("FinancialInstrument")install.packages("PerformanceAnalytics")install.packages("foreach") Step2. R Programming A-Z™: Download Practice Datasets. Join The SuperDataScience Club Here: R - Plot data in multiple files using ggplot.
R Programming: Plotting time-series data (using data.frame) Updating R from R (on Windows) – using the {installr} package. Upgrading R on Windows is not easy. While the R FAQ offer guidelines, some users may prefer to simply run a command in order to upgrade their R to the latest version. That is what the new {installr} package is all about. The {installr} package offers a set of R functions for the installation and updating of software (currently, only on Windows OS), with a special focus on R itself. To update R, you can simply run the following code: Running this function will perform the following steps: An Introduction To R for Trading w/Ilya Kipnis. Using R in real time financial market trading. R in finance. Quantmod: Quantitative Financial Modelling Framework. Impatient R. Translations français: Translated by Kate Bondareva. Serbo-Croatian: Translated by Jovana Milutinovich from Geeks Education. Preface This is a tutorial (previously known as “Some hints for the R beginner”) for beginning to learn the R programming language.
It is a tree of pages — move through the pages in whatever way best suits your style of learning. You are probably impatient to learn R — most people are. This page has several sections, they can be put into the four categories: General, Objects, Actions, Help. General Introduction Blank screen syndrome Misconceptions because of a previous language Helpful computer environments R vocabulary Epilogue Objects. Some hints for the R beginner. GitHub - swirldev/swirl_courses: A collection of interactive courses for the swirl R package. Microsoft R Open: The Enhanced R Distribution · MRAN. Skip to main content. Announcing R Tools for Visual Studio. This post is by Shahrokh Mortazavi, Partner Director of Program Management in the Data Group at Microsoft.
16 courses to learn R in 2016 - Master Data Analysis. Explore Statistics with R. Do you want to learn how to harvest health science data from the Internet? Or learn to understand the world through data analysis? Intermediate R. Range, variance and standard deviation as measures of dispersion. R news and tutorials contributed by (573) R bloggers. Amazon. Why R. R (see also here) is a free language and environment for statistical computing and graphics. It is superior to other graphics/analysis packages commonly used in Astronomy, e.g. supermongo, pgplot, gnuplot, and features a very wide range of statistical analysis and data plotting functions.
Furthermore, R is already the most popular amongst the leading software for statistical analysis, as measured by a variety of indicators, and is rapidly growing in influence. R is really important to the point that it’s hard to overvalue it. It allows statisticians to do very intricate and complicated analyses without knowing the blood and guts of computing systems. Google research scientist, quoted in the New York Times These pages are intended to be a brief summary of some basic information needed to get started quickly with R in a broadly astronomical context.