
The evolution of the Latin alphabet, courtesy of... The evolution of the Latin alphabet, courtesy of data artist Matt Baker.
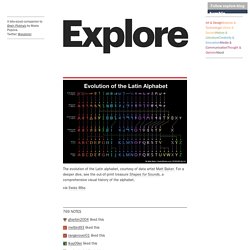
For a deeper dive, see the out-of-print treasure Shapes for Sounds, a comprehensive visual history of the alphabet. via Swiss Miss. Methods Map: Key concepts in research: SAGE Research Methods. The Open Source Definition. Open source doesn't just mean access to the source code. The distribution terms of open-source software must comply with the following criteria: 1. Free Redistribution The license shall not restrict any party from selling or giving away the software as a component of an aggregate software distribution containing programs from several different sources. The license shall not require a royalty or other fee for such sale. 2.
The program must include source code, and must allow distribution in source code as well as compiled form. Open Source Initiative. The OpenScience Project. The OpenScience project is dedicated to writing and releasing free and Open Source scientific software.
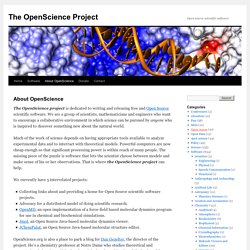
We are a group of scientists, mathematicians and engineers who want to encourage a collaborative environment in which science can be pursued by anyone who is inspired to discover something new about the natural world. Much of the work of science depends on having appropriate tools available to analyze experimental data and to interract with theoretical models. Powerful computers are now cheap enough so that significant processing power is within reach of many people.
The missing piece of the puzzle is software that lets the scientist choose between models and make sense of his or her observations. That is where the OpenScience project can help. We currently have 5 interrelated projects: OpenScience.org is also a place to park a blog for Dan Gezelter, the director of the project.
Eigenfactor: Maps of Science. Click on any of the maps to load a high-resolution (vector-based) PDF file.
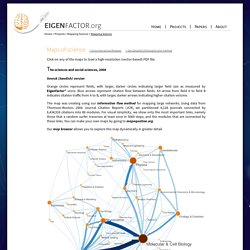
The sciences and social sciences, 2004 Svensk (Swedish) version Orange circles represent fields, with larger, darker circles indicating larger field size as measured by Eigenfactor® score. Blue arrows represent citation flow between fields. An arrow from field A to field B indicates citation traffic from A to B, with larger, darker arrows indicating higher citation volume. The map was creating using our information flow method for mapping large networks. Our map browser allows you to explore this map dynamically in greater detail. The social sciences, 2004. Sci2004. Maps Detail. Map of Science. Clickstream Data Yields High-Resolution Maps of Science. According to the above mentioned methodology we constructed a map of science that visualizes the relationships between journals according to user clickstreams.
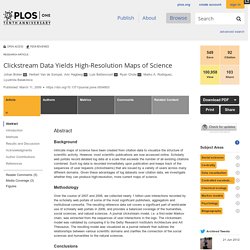
We first discuss the visual structure of the map, and then attempt to validate the structural features of its underlying clickstream model by comparing the latter to journal centrality rankings and an alternative model of journal relations derived from classification data. A clickstream map of science. MAPofScience. Eigenfactor: Interactive map browser. Places & Spaces: Mapping Science. Nova Anglia, Novvm Belgivm et Virginia, by Johannes Janssonius, 1642.
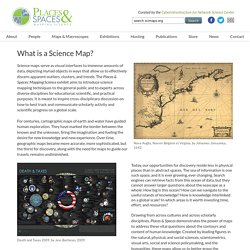
Science maps serve as visual interfaces to immense amounts of data, depicting myriad objects in ways that allow us to effectively discern apparent outliers, clusters, and trends. The Places & Spaces: Mapping Science exhibit aims to introduce science mapping techniques to the general public and to experts across diverse disciplines for educational, scientific, and practical purposes. It is meant to inspire cross-disciplinary discussion on how to best track and communicate scholarly activity and scientific progress on a global scale. For centuries, cartographic maps of earth and water have guided human exploration.
They have marked the border between the known and the unknown, firing the imagination and fueling the desire for new knowledge and new experience. Death and Taxes 2009, by Jess Bachman, 2009. Today, our opportunities for discovery reside less in physical places than in abstract spaces. Excellence Networks. About This web application visualizes how successful universities or research-focused institutions collaborate.
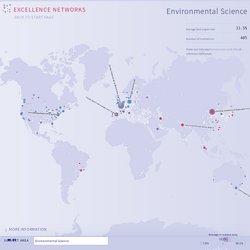
The application is based on papers (articles, reviews and conference papers) published between 2009 and 2013 in several subject areas. For each subject area, those institutions (universities and research-focused institutions worldwide) were selected in the SCImago Institutions Ranking which published at least 500 papers in the publication period.
We refer to these institutions as "reference institutions". For every reference institution, the collaborating institutions were identified. Collaborating institutions are those which have co-authored at least ten publications with the respective reference institution. Definitions Reference institution: A reference institution provides for the ego in the egocentric network. See also Our related web application excellencemapping.net visualizes scientific excellence worldwide in several subject areas. NISTEP 2014 NR159 SummaryE1.