
5 Whys. The 5 Whys is an iterative question-asking technique used to explore the cause-and-effect relationships underlying a particular problem.[1] The primary goal of the technique is to determine the root cause of a defect or problem.
(The "5" in the name derives from an empirical observation on the number of iterations typically required to resolve the problem.) Example[edit] The vehicle will not start. (the problem)Why? - The battery is dead. The questioning for this example could be taken further to a sixth, seventh, or higher level, but five iterations of asking why is generally sufficient to get to a root cause.
It is interesting to note that the last answer points to a process. A key phrase to keep in mind in any 5 Why exercise is "people do not fail, processes do". History[edit] The technique was originally developed by Sakichi Toyoda and was used within the Toyota Motor Corporation during the evolution of its manufacturing methodologies. Techniques[edit] Criticism[edit] See also[edit] 5-whys Analysis using an Excel Spreadsheet Table. Find out how to visualize your five-whys analysis by putting it into a spreadsheet, including a downloadable five why template and tutorial.

Part 2 of a four part series on 5-whys. By Karn G. Bulsuk More information: An Introduction to 5-whys, 5-whys Analysis using a Fishbone Diagram and The Weaknesses of 5-WhysDownloads: 5-whys Template Download and Step-by-step example on how to perform a 5-why analysis Visualizing your 5-whys analysis in a table is the best way to show the causal links between your causes and the ultimate root causes. Imagine that there is a company called Alencia which specializes in receiving outsourced executive recruitment work, where they match talent to specific jobs and receive commission for doing so. In the past year, demand has boomed and their business has expanded rapidly, but at a price: while demand has increased, capacity has remained the same, leading to a large back log of job requests.
Setting Up the Excel Sheet. An Introduction to 5-why. Learn how to find root causes of a problem by using 5-why analysis, so you can fix the issues where it matters most.
First in a series of four articles explaining this powerful tool. By Karn G. Bulsuk More information: 5-why Analysis using a Fishbone Diagram, 5-why Analysis using an Excel Spreadsheet Table and The Weaknesses of 5-Why 5-why analysis, used throughout the kaizen concept and in quality control, is a tool to discover the root causes of a problem. More often than not, people fix a problem by dealing with issues that are immediately apparent. For example, suppose we had a tree which was wilting and dying. Instead, we need to investigate the cause of the wilting. Toyota Motor Engineering & Manufacturing North America, Inc. - Ishikawa diagram. Ishikawa diagrams (also called fishbone diagrams, herringbone diagrams, cause-and-effect diagrams, or Fishikawa) are causal diagrams created by Kaoru Ishikawa (1968) that show the causes of a specific event.[1][2] Common uses of the Ishikawa diagram are product design and quality defect prevention, to identify potential factors causing an overall effect.

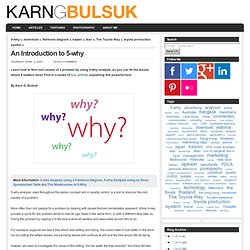
Each cause or reason for imperfection is a source of variation. Causes are usually grouped into major categories to identify these sources of variation. The categories typically include: Overview[edit] Ishikawa diagram, in fishbone shape, showing factors of Equipment, Process, People, Materials, Environment and Management, all affecting the overall problem. Ishikawa diagrams were popularized by Kaoru Ishikawa[3] in the 1960s, who pioneered quality management processes in the Kawasaki shipyards, and in the process became one of the founding fathers of modern management. Causes[edit] Causes can be derived from brainstorming sessions. Www.adb.org/sites/default/files/pub/2009/the-five-whys-technique.pdf.