
The 10 Essential Mobile App Metrics Formulas. As a mobile marketer, you’re a relationship builder. And like any relationship you invest in, you want to get a sense of how things are going. Are you and the other party—in this case, those who have downloaded and use your app—both getting what you want out of the relationship? What’s working, what’s not? The following mobile metrics formulas will help you measure the impact of the hard work you put in to develop your audience. 1. This metric, obviously, lets you know what percentage of customers you’re retaining. Which numbers you plug into the formula will depend on what you’re looking to learn from the retention rate, but you’re comparing a cohort of users in a more recent timeframe (say, this month), with those same users in an earlier timeframe (say, last month). You might also be interested in calculating your retention rate using app download or first login as the denominator (as opposed to just app use). 2. 3. 4. 5. 6. 7. 8. 9. 10.
Measuring the Lifetime Value of a Mobile Customer. Guest post by Alex Walz (Apptentive).
The difference between apps that sell for millions of dollars and apps that never see a dime can often be narrowed down to a single point: How well their developers and marketers understand the value of a customer. Customer lifetime value (CLTV) is at once both one of the most powerful metrics in the mobile app publisher’s toolbox and one of the most enigmatic. CLTV can serve many purposes: an indicator of your health’s success, a reminder of the power of customer loyalty, and a tool for forecasting growth. But at its simplest, customer lifetime value is what drives (or what should drive) your mobile marketing budget.
It tells you how much each new customer is worth – and how much you can pay to acquire that customer. In this post, I’ll breakdown mobile customer lifetime value into the much-more-tangible parts that make up this broad metric and provide tips and best practices for calculating each element. The 3 Drivers of Customer Lifetime Value 1. 2. Choosing App Store Keywords and App Name for ASO. Last updated: January 10, 2016 You want your potential customers to be able to find you through search on the App Store because over half of apps are discovered this way.
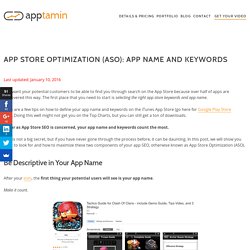
The first place that you need to start is selecting the right app store keywords and app name. App Store Optimization (ASO): App Name And Keywords. App Promo Codes: Everything You Need To Know. Updated: January 27, 2016 App promo codes can help you with your app marketing, regardless you have a paid or a free app.

It’s a great way to have a key influencer or press contact try your app before its launch, and if you have a paid app it’s the best way to have them try it for free. Apple has had them forever, but now Google has finally made them available to app developers. Let’s take a look at how they work and how to use them effectively for both iOS and Android apps. We will start with the basics then give you some tips on how to leverage this powerful marketing tool. App Store Promo Codes 50 100 codes per release, 28 days per code. Apple gives you the ability to give away 100 promo codes per release. Each code is valid for 28 days after it was requested and can only be used once. New data shows losing 80% of mobile users is normal, and why the best apps do better at andrewchen.
Exclusive data on retention curves for mobile apps In a recent essay covering the Next Feature Fallacy, I explained why shipping “just one more feature” doesn’t fix your product.
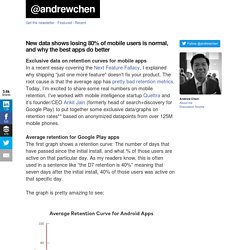
The root cause is that the average app has pretty bad retention metrics. Today, I’m excited to share some real numbers on mobile retention. I’ve worked with mobile intelligence startup Quettra and it’s founder/CEO Ankit Jain (formerly head of search+discovery for Google Play) to put together some exclusive data/graphs on retention rates** based on anonymized datapoints from over 125M mobile phones. Average retention for Google Play apps The first graph shows a retention curve: The number of days that have passed since the initial install, and what % of those users are active on that particular day.
As my readers know, this is often used in a sentence like “the D7 retention is 40%” meaning that seven days after the initial install, 40% of those users was active on that specific day. How do the best apps perform? The 10 Essential Mobile App Metrics Formulas. Mobile Apps: What’s A Good Retention Rate? Editor's Note: This article was originally published in March of 2016, but has been updated with the latest mobile app retention data as of March 22, 2018.
Let’s face it, as mobile app marketers, we’re going through some growing pains. The rapid evolution of the mobile industry has led to some missteps in communicating with our users, and as a result, we’re losing them. In fact, we’re in the middle of a mobile engagement crisis. Consequently, on its path to becoming our knight in shining armor, mobile must break the mold of being a fling, and it’s up to us marketers to champion this change. How do we do this? Shifting the Focus Away From Acquisition to Retention.