
The Most Important Price Action Formation is Indecision. Article Summary: Traders can use price itself to grade trends, find support and resistance, and trigger trades.Traders are best served by utilizing advantageous risk-reward ratios.Price Action formations can be combined with trends or biases to look for situations in which the trader may be able to buy cheap, or sell expensive.
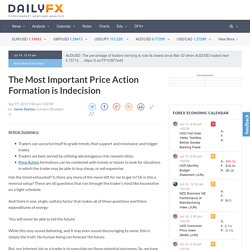
Has the trend exhausted? Is there any more of the move left for me to get in? Or is this a reversal setup? These are all questions that run through the trader’s mind like locomotive on a tight schedule. And there is one, single, solitary factor that makes all of these questions worthless expenditures of energy: Trading the imperfect double top - PART I. - TraderSkillset. When it comes to the chart pattern of double tops, traders often look for perfection.
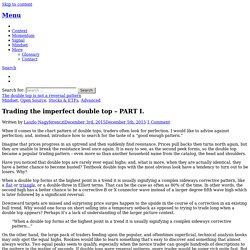
I would like to advise against perfection; and, instead, introduce how to search for the taste of a “good enough pattern.” Imagine that prices progress in an uptrend and then suddenly find resistance. Prices pull backs then turns north again, but they are unable to break the resistance level once again. 9 Rules for Trading Divergences. Before you head out there and start looking for potential divergences, here are nine cool rules for trading divergences.
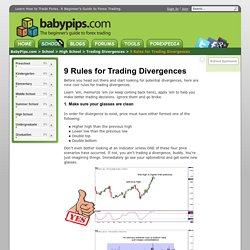
Learn ’em, memorize ’em (or keep coming back here), apply ’em to help you make better trading decisions. Ignore them and go broke. 1. Make sure your glasses are clean In order for divergence to exist, price must have either formed one of the following: How to Trade Fakeouts in Forex. In order to fade breakouts, you need to know where potential fakeouts can occur.
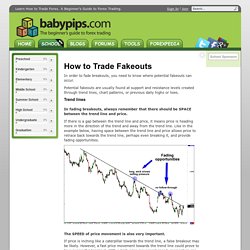
Potential fakeouts are usually found at support and resistance levels created through trend lines, chart patterns, or previous daily highs or lows. Trend lines In fading breakouts, always remember that there should be SPACE between the trend line and price. How to Trade Wedge Chart Patterns in Forex. Wedges signal a pause in the current trend.
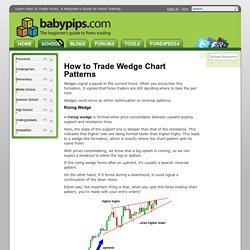
When you encounter this formation, it signals that forex traders are still deciding where to take the pair next. Wedges could serve as either continuation or reversal patterns. Rising Wedge A rising wedge is formed when price consolidates between upward sloping support and resistance lines. Here, the slope of the support line is steeper than that of the resistance. With prices consolidating, we know that a big splash is coming, so we can expect a breakout to either the top or bottom. If the rising wedge forms after an uptrend, it’s usually a bearish reversal pattern. On the other hand, if it forms during a downtrend, it could signal a continuation of the down move. Either way, the important thing is that, when you spot this forex trading chart pattern, you’re ready with your entry orders!
Trading Candlestick Patterns with Moving Averages. Before we discuss about the strategy, let’s talk a little about Moving Averages.
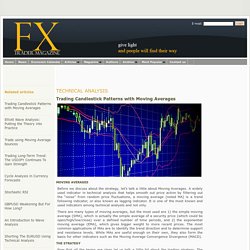
A widely used indicator in technical analysis that helps smooth out price action by filtering out the “noise” from random price fluctuations, a moving average (noted MA) is a trend following indicator, or also known as lagging indicator. It is one of the most known and used indicators among technical analysts and not only. There are many types of moving averages, but the most used are 1) the simple moving average (SMA), which is actually the simple average of a security price (which could be open/high/low/close) over a defined number of time periods, and 2) the exponential moving average (EMA), which gives bigger weight to more recent prices. How to Trade Support and Resistance in Forex.
Now that you know the basics, it’s time to apply these basic but extremely useful technical tools in your trading.
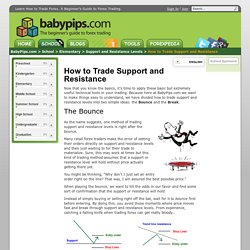
Because here at BabyPips.com we want to make things easy to understand, we have divided how to trade support and resistance levels into two simple ideas: the Bounce and the Break. As the name suggests, one method of trading support and resistance levels is right after the bounce. Learn Forex: Trading the Forex Bear Flags to Short the Market. Forex bear flag patterns provide excellent setups to join a strong downtrend.Flag patterns are easy to recognize and have good risk to reward setups with small stops and large limits.The tighter the consolidation and more overlapping price action, the more reliable the pattern.
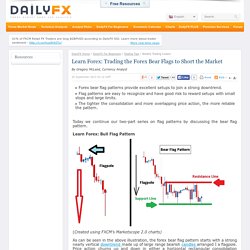
Today we continue our two-part series on flag patterns by discussing the bear flag pattern. Learn Forex: Bull Flag Pattern (Created using FXCM’s Marketscope 2.0 charts) As can be seen in the above illustration, the forex bear flag pattern starts with a strong nearly vertical downtrend made up of large range bearish candles arranged I a flagpole.
Price action churns up and down in either a horizontal rectangular consolidation between a well-define areas of support and resistance. On some occasions, the channel may be angled upward as buyers struggle to push price higher against the prevailing market tide. Trading the Range. Talking Points: Range-bound market conditions occur approximately 70% of the time.

Trading ranges could offer more opportunistic risk-reward opportunity. We share various ways that traders can look to approach range-bound conditions. Most new retail traders hate trading in range-bound market conditions. The desire for trading a strong trend makes sense; these types of positions can offer fantastic risk-reward potential. Unfortunately, trending markets are more of the exception than the rule. Nonetheless, most retail traders try to ignore the range. But a question that every trader needs to ask themselves: Are you trading for fun, or profit?
3 Steps to a Forex Trend Trade. Walker England, Forex Trading Instructor Talking Points.
Learn Forex: How to Trade a Descending Triangle. Talking Points -Triangle price patterns can be used in Forex trading to identify potential breakout setups - Descending triangles form when a rising trend line and a horizontal support line converge - Traders can look for the breakout from the descending triangle to signal the continuation of the AUDJPY down move. Learn How to Short the Market with Bear Flag Chart Pattern. I Like It Best When The Patterns Don't Work - All Star Charts with JC Parets. Posted by JC Parets on October 29th, 2014 There is this misconception out there about technical analysis that there are these magical patterns that should always result in a specific move or direction.
If and when they don’t, the misinformed chart watcher claims that technical analysis doesn’t work or that it no longer works or something along those ignorant lines. Know the 3 Main Groups of Chart Patterns. That’s a whole lot of chart patterns we just taught you right there. We’re pretty tired so it’s time for us to take off and leave it to you from here… Just playin’! We ain’t leaving you till you’re ready! How to Trade Bearish and Bullish Pennants in Forex. Bearish Pennants Similar to rectangles, pennants are continuation chart patterns formed after strong moves. After a big upward or downward move, buyers or sellers usually pause to catch their breath before taking the pair further in the same direction.
Because of this, the price usually consolidates and forms a tiny symmetrical triangle, which is called a pennant. Trading The Gartley Pattern. Once upon a time, there was this insanely smart trader dude named Harold McKinley Gartley. He had a stock market advisory service in the mid-1930s with a huge following. This service was one of the first to apply scientific and statistical methods to analyze the stock market behavior. According to Gartley, he was finally able to solve two of the biggest problems of traders: what and when to buy. Soon enough, traders realized that these patterns could also be applied to other markets. Since then, various books, trading software, and other patterns (discussed below) have been made based on the Gartleys. Gartley a.k.a. “222” Pattern The Gartley “222” pattern is named for the page number it is found on in H.M.
Retracement or Reversal? Have you ever been in this situation before? It looks as though price action may be rallying and a buy trade is in order. You’ve been hit by the “Smooth Retracement!” Nobody likes to be hit the “Smooth Retracement” but, sadly, it does happen. Why? How to Trade Double Tops and Double Bottoms in Forex. Double Top. The ABCD and the Three-Drive.