
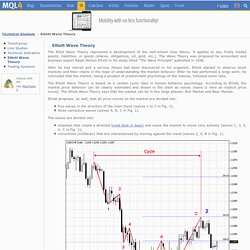
Elliott Wave Theory - Technical Analysis. The Elliot Wave Theory represents a development of the well-known Dow theory.
'Principles of Time Transformation in Intraday Trading - MQL4 Articles. Introduction Statistical homogeneity of observations always plays an important role in analyzing previous price movements.
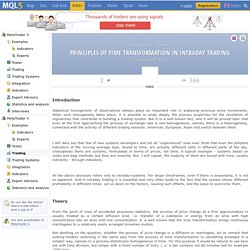
When such homogeneity takes place, it is possible to study deeply the process properties for the revelation of regularities that contribute to building a trading system. 'Using MetaTrader 5 Indicators with ENCOG Machine Learning Framework for Timeseries Prediction. Introduction This article will introduce MetaTrader 5 to ENCOG - advanced neural network and machine learning framework developed by Heaton Research.
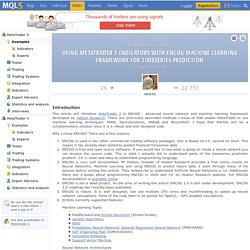
There are previously described methods I know of that enable MetaTrader to use machine learning techniques: FANN, NeuroSolutions, Matlab and NeuroShell. I hope that ENCOG will be a complementary solution since it is a robust and well designed code. How to Place Stop Losses and Take Profits Using a Maximal Strategy. When entering a trade, how do you choose the point of the stop loss and take profit?
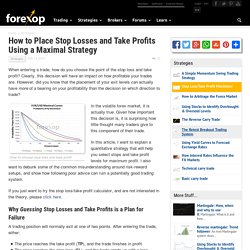
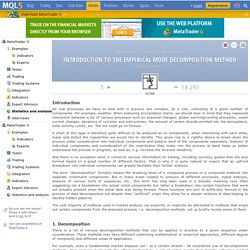
Clearly, this decision will have an impact on how profitable your trades are. However, did you know that the placement of your exit levels can actually have more of a bearing on your profitability than the decision on which direction to trade? How to choose stop loss and take profit In the volatile forex market, it is actually true. Random Walk Model. Simple forecasting models Statistics review and the simplest forecasting model: the sample mean (pdf)Notes on the random walk model (pdf)Mean (constant) modelLinear trend model Random walk modelGeometric random walk model Three types of forecasts: estimation, validation, and the future When faced with a time series that shows irregular growth, such as Series #2 analyzed earlier, the best strategy may not be to try to directly predict the level of the series at each period (i.e., the quantity Yt).
Instead, it may be better to try to predict the change that occurs from one period to the next (i.e., the quantity Yt - Yt-1).
Money management. Grid trading. 'Introduction to the Empirical Mode Decomposition Method. Introduction All real processes we have to deal with in practice are complex, as a rule, consisting of a great number of components.
For example, weather. When analyzing precipitation charts, we should bear in mind that they represent interaction between a lot of various processes such as seasonal changes, global warming/cooling processes, ocean current changes, dynamics of cyclones and anticyclones, the amount of carbon dioxide emitted into the atmosphere, solar activity cycles, etc. 'Econometric Approach to Analysis of Charts. Theories without facts may be barren, but facts without theories are meaningless.
K. Boulding Introduction. ICMarkets. MQL5 community. Como ganhar dinheiro com o FOREX. Martingale simulator. Teoria da Reflexividade. George Soros, todos o conhecem e é inegável sua capacidade de timing no que se refere a percepção à respeito do conceito de tendências.
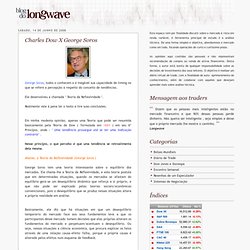
Ele desenvolveu a chamada " Teoria da Reflexividade ". Realmente vale à pena ler o texto e tire suas conclusões. Em minha modesta opinião, apenas uma Teoria que pode ser resumida basicamente pela Teoria de Dow ( formulada em 1884 ) em seu 6º Princípio, onde : " Uma tendência prossegue até se ter uma indicação contrária" . Nesse princípio, o que percebo é que uma tendência se retroalimenta dela mesma. Abaixo, a Teoria da Reflexividade (George Soros ) George Soros tem uma teoria interessante sobre o equilíbrio dos mercados.
Basicamente, ele diz que há situações em que um desequilíbrio temporário do mercado face aos seus fundamentos leva a que os participantes desse mercado tomem decisões que elas próprias alteram os fundamentos do mercado e perpetuam/acentuam o desequilíbrio. Isto se vê melhor usando exemplos. Este é um tema recorrente nos mercados. OrderFlowFX. Several Ways of Finding a Trend in MQL5. Introduction Any trader knows the rule "Trend is your friend, follow the trend", but almost everyone has his own idea about what a trend is.
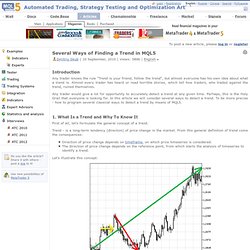
Almost every trader has heard or read horrible stories, which tell how traders, who traded against the trend, ruined themselves. The Basics of Object-Oriented Programming. Introduction We can assume that anyone who tried to start learning object-oriented programming (OOP), first encountered such words as polymorphism, encapsulation, overload and inheritance.
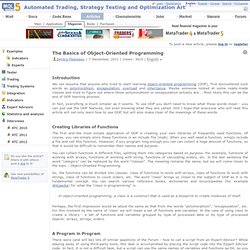
Maybe someone looked at some ready-made classes and tried to figure out where those polymorphism or encapsulation actually are... Most likely this can be the end of OOP learning process. In fact, everything is much simpler as it seems. William Blau's Indicators and Trading Systems in MQL5. Part 1: Indicators. Technical trading can only be exploited if good tools are avaliable.The tools of a good trader are experience, judgement, and a mathematical hierarchy provided by good trading computer program.William Blau Introduction The first part of the article "Indicators and Trade Systems in MQL5 by William Blau. Part 1: Indicators " is a description of indicators and oscillators, described by William Blau in the book "Momentum, Direction, and Divergence". The indicators and oscillators, described in this article, are presented as a source codes in MQL5 language and attached in the archive file "Blau_Indicators_MQL5_en.zip".
The key idea of analysis by William Blau The technical analysis by William Blau consists of four phases: Using the price series data (q bars) the indicator is calculated and plotted at chart. Indicators The article describes the following groups of indicators: Advanced Adaptive Indicators Theory and Implementation in MQL5. Introduction This article is based on two excellent books by John F. Ehlers: "Rocket Science for Traders" and "Сybernetic Analysis for Stock and Futures". The unusual approach to market analysis using digital signal processing methods and adopting complex numbers to market cycle recognition made me go deeper into this subject and subsequently implement in MQL5 three adaptive indicators presented by J.F.Ehlers.
This article will describe the basic theory behind the adaptive indicators and their MQL5 implementation.