
Who Likes What? Social Media By Demographic. The Top 10 Twitter Trends Of 2011 [INFOGRAPHIC] Happy 4th Anniversary, iPhone [INFOGRAPHIC] Four years ago today, Apple released the original iPhone.
![Happy 4th Anniversary, iPhone [INFOGRAPHIC]](http://cdn.pearltrees.com/s/pic/th/anniversary-iphone-infographic-13133257)
The hype that preceded the release of the so-called "Jesus Phone" was nothing short of staggering. Analysts, tech blogs and consumers oscillated between hyping the phone as the second-coming or deriding it as much-ado about nothing. In 2007, I was both an Apple fan (I purchased my first iPod in 2002) and a mobile phone fanatic. Still, I had my doubts about the iPhone because of its outlandish price, its carrier lock (and the carrier of choice) and the lack of third-party applications. I thought, OK, the iPhone will probably sell pretty well, but it's not going to change the mobile phone industry. The details and investment into the narrative surrounding the iPhone's launch wasn't like other tech products — or even other Apple products. In four years, the iPhone has utterly transformed the mobile industry.
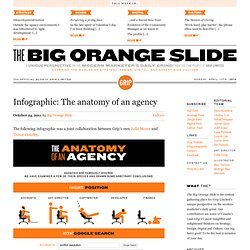
The iPhone not only transformed the mobile industry, but changed Apple as a company. Infographic: The anatomy of an agency « Big Orange Slide. Ideavelopmentreation Outside the agency environment, I was introduced to Agile development: [...]

Forgiving a pretty face. Status Update: Does Social Media Use Compromise The Security of Your Home? Mobile Marketing. Infographic on Content Marketing. Tablet Owners Spend More Time and Money Shopping Online [INFOGRAPHIC] The increasing number of tablet owners in the U.S. is changing the way people shop from in-store to online — 20% of all mobile ecommerce sales now come from tablets and 60% of tablet owners have purchased goods using a tablet.
![Tablet Owners Spend More Time and Money Shopping Online [INFOGRAPHIC]](http://cdn.pearltrees.com/s/pic/th/category-shoppers-infographic-19271944)
Tablet users spend an average of one hour and 35 minutes on their devices and typically spend 10-20% more on purchases than shoppers without tablets. By 2016, mobile commerce is expected to increase to $31 billion in the U.S. - a tremendous jump from only $3 billion in 2010. What is Cyber Monday? 11 New Twitter Facts, Figures and Growth Statistics plus [INFOGRAPHIC] LinkedIn Bootcamp [INFOGRAPHIC] by MindFlash. Social Media Marketing - 10 Inspiring Infographics. In 2011 social media marketing continued to make its impact on business and brand promotions.

Google+ was launched (with an investment of over $500 million in development costs), Twitter became embedded in the new Apple iPhone 4s and Blogging didn’t die. Facebook soared past 800 million users and Twitter continued its upward trajectory past 200 million members. Who's Tweeting About Black Friday? [INFOGRAPHIC] As retailers prepare for post-Thanksgiving holiday shopping, consumers increasingly turn online to search for the best deals.
![Who's Tweeting About Black Friday? [INFOGRAPHIC]](http://cdn.pearltrees.com/s/pic/th/tweeting-friday-infographic-19018497)
Last year, according to the National Retail Federation, 212 million individuals spent an estimated $45 billion total on Black Friday. This year, social media has played a big role in Black Friday marketing, and buzz about when and where consumers are shopping is stronger than ever. Black Friday is already trending on Twitter, and it's no surprise, especially since most companies are expanding sales from Thursday night all the way up to Cyber Monday. Foursquare Checkins Reveal Holiday Travel Patterns [INFOGRAPHIC] Click image to enlarge.
![Foursquare Checkins Reveal Holiday Travel Patterns [INFOGRAPHIC]](http://cdn.pearltrees.com/s/pic/th/foursquare-infographic-19051280)
In honor of Thanksgiving travel, Foursquare has posted an infographic on the company's blog showing checkins related to travel in the United States by plane, train, and automobile, covering a period from Halloween until just after Christmas in 2010. For airplane and train travel, data is pulled when someone checks in on Foursqure at two different airports or train stations in the same day. Automobile traffic, according to the graphic, is based on checkins on highways and roads, which sounds more ambiguous and harder to correlate specifically to travel, but it does show quite neatly the major interstates across the United States.
The Social Engine of Sport. The State Of Social Media In The UK [INFOGRAPHIC] Tweet Me Out To The Ball Game. How Does AdWords Work? A Google AdWords Infographic. If you work in the search marketing industry, you may have found yourself having a conversation somewhat like this one (the same conversation I have every time I tell a "regular person" what I do): Regular Person: So, what do you do?

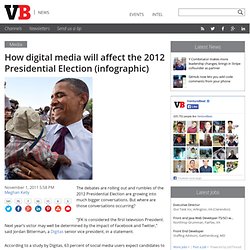
Me: I work as a writer for a software startup. Regular Person: What kind of software? Me: Um, search marketing software? Regular Person: So ... like Google? Me: Well, yeah, sort of. Infographics & Data Visualizations - Visual.ly. Inspired Magazine. Infographic Of The Day: Facebook Networks Become A Living Light Show. How digital media will affect the 2012 Presidential Election (infographic) The debates are rolling out and rumbles of the 2012 Presidential Election are growing into much bigger conversations.

But where are those conversations occurring? “JFK is considered the first television President. Next year’s victor may well be determined by the impact of Facebook and Twitter,” said Jordan Bitterman, a Digitas senior vice president, in a statement. According to a study by Digitas, 63 percent of social media users expect candidates to have a social media presence. On top of that, 88 percent of social media users who are also registered voters have mobile phones. Open Courses For All. How Does Facebook Affect You and Your Relationships. The Science of Sharing. @aliphalen TweetSheet by Vizify.
How Does Your Klout Score Describe Your Influence? #infographic #chart. Inbound Marketing vs. Outbound Marketing [INFOGRAPHIC] Thanks to the Internet, marketing has evolved over the years.
![Inbound Marketing vs. Outbound Marketing [INFOGRAPHIC]](http://cdn.pearltrees.com/s/pic/th/marketing-outbound-infographic-17992543)
Consumers no longer rely on billboards and TV spots — a.k.a. outbound marketing — to learn about new products, because the web has empowered them. It's given them alternative methods for finding, buying and researching brands and products. The new marketing communication — inbound marketing — has become a two-way dialogue, much of which is facilitated by social media. Another reason why inbound marketing is winning is because it costs less than traditional marketing. Why try to buy your way in when consumers aren't even paying attention? 44% of direct mail is never opened. Inbound marketing focuses on earning, not buying, a person's attention, which is done through social media and engaging content, such as blogs, podcasts and white papers. Twitter Psychology. Students Love Technology. The Science of Sharing. Open Courses For All. The History of Advertising on Facebook [INFOGRAPHIC] iPhone History: The Story So Far [INFOGRAPHIC]
What Devices And Social Networks Are Travelers Using With In-Flight Wi-Fi. Infographic: The Best Ways to Add (and Lose) Twitter Followers. What's trendy in the Twittersphere. What Are The Top 20 Most Expensive Keyword Categories For Advertising Using Google Adwords? Any surprises.