
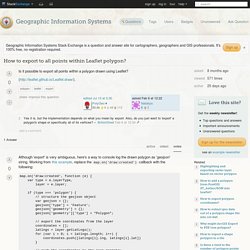
How to export to all points within Leaflet polygon? Current community your communities Sign up or log in to customize your list. more stack exchange communities company blog Stack Exchange Inbox Reputation and Badges sign up log in tour help Geographic Information Systems Ask Question Sign up × Geographic Information Systems Stack Exchange is a question and answer site for cartographers, geographers and GIS professionals.
From Google Maps to Open Source With MapBox and Leaflet. Leaflet WebGL many points rendering. WebGL is funny – programming in very low level style in JavaScript.
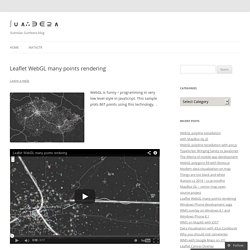
This sample plots 86T points using this technology. . The code is very straightforward, the only thing is to how points are initially loaded and scaled (instead of reloading each time when map moves). All points are initially transformed to tile size of 256 x 256 pixels at zoom level 0 and then re-scaled/re-shifted based on the current position of the map. drawingOnCanvas is called from L.CanvasOverlay each time map needs to be drawn (move, zoom) More information and insipiration I took from this site. Digital Geography. Digital Geography. Bounds D3 extent leaflet Lealfet Mapping scales zoombar Within this, 2nd basic D3 tutorial, I will show you how to combine D3 with Leaflet whereby each library can demonstrate its vantages!
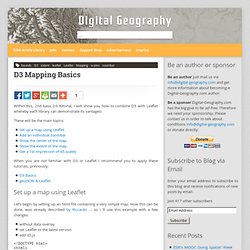
These will be the main topics: When you are not familiar with D3 or Leaflet I recommend you to apply these tutorials, previously: Set up a map using Leaflet Let’s begin by setting up an html-file containing a very simple map. Perrygeo/leaflet-simple-csv. Pettijohn85 - - United States. Professional Web Developer Username: pettijohn85 Has verified their email address.

Has completed their profile. Has verified their secure phone number. Verified Location: Tacoma, United States Member since: July 2013. Leaflet-plugins. Miscellaneous plugins for Leaflet library for services that need to display route information and need satellite imagery from different providers.
Currently it consists of: Vector layers (layer/vector/): Providers (layer/tile): Google - using Google Maps API v3; Yandex - using Yandex Maps API v2; Bing - with propper attribution. All theese providers are implemented with respect to terms of use. Also there are some useful control plugins (control/): Permalink - OpenLayers compatible permanent link with support of storing location data in hash part (#lat=…); Scale - scale ruler which looks like one on paper maps. A example of using Google Map tiles with the Leaflet mapping library -
Leaflet Map API with Google Satellite Layer. Using Leaflet with a database. The previous two posts created a map with markers.
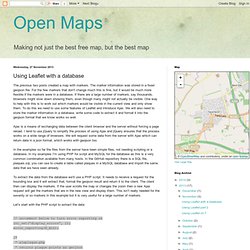
The marker information was stored in a fixed geojson file. For the few markers that don't change much this is fine, but it would be much more flexible if the markers were in a database. If there are a large number of markers, say thousands, browsers might slow down showing them, even though many might not actually be visible. One way to help with this is to work out which markers would be visible in the current view and only show them. To do this we need to use some features of Leaflet and introduce Ajax. Ajax is a means of exchanging data between the client browser and the server without forcing a page reload.
In the examples so far the files from the server have been simple files, not needing scripting or a database. To extract the data from the database we'll use a PHP script. Let's start with the PHP script to extract the data: // uncomment below to turn error reporting onini_set('display_errors', 1);error_reporting(E_ALL); How to check point lies inside/outside of polygon or rectangle. Leaflet/Leaflet.draw. Leaflet-dvf. Overview The Leaflet DVF is an extension to CloudMade's Leaflet JavaScript mapping library.
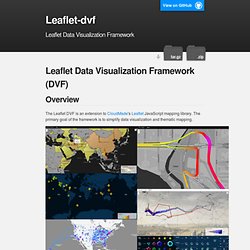
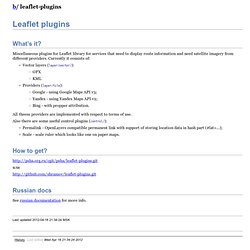
The primary goal of the framework is to simplify data visualization and thematic mapping. It includes: New marker types (see the markers example below): CartoDB template gallery - @mhkeller. D3 + Leaflet. This is a quick demonstration of using D3 to render GeoJSON shapes in conjunction with Leaflet.
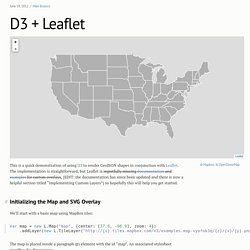
The implementation is straightforward, but Leaflet is regretfully missing documentation and examples for custom overlays, [EDIT: the documentation has since been updated and there is now a helpful section titled “Implementing Custom Layers”] so hopefully this will help you get started. #Initializing the Map and SVG Overlay We’ll start with a basic map using MapBox tiles: The map is placed inside a paragraph (p) element with the id “map”. An associated stylesheet specifies the dimensions: Next, we add an SVG element to Leaflet’s overlay pane. Var svg = d3.select(map.getPanes().overlayPane).append("svg"), g = svg.append("g").attr("class", "leaflet-zoom-hide"); Inside the SVG, you’ll also need a G (group) element. #Loading and Projecting GeoJSON Next, we load the GeoJSON file using d3.json: d3.json("us-states.json", function(collection) { }); Leaflet.FileLoader Plugin for Leaflet Maps. Read AND write to CartoDB with the Leaflet.draw plugin.
Read AND write to CartoDB with the Leaflet.draw plugin. GeoJSON Leaflet Tile Layer. Glenrobertson/leaflet-tilelayer-geojson. Read AND write to CartoDB with the Leaflet.draw plugin. Merging polygons in QGIS. Leaflet Heat. Mapbox/leaflet-omnivore. ToGeoJSON. Leaflet Vector Layers - ArcGIS Server Demo. Light Rail Lines This example has a simple, single symbology and uses the showAll parameter to fetch all features at once since there are only a handful.
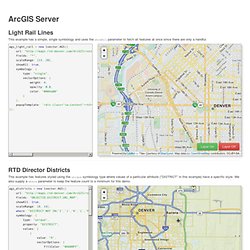
RTD Director Districts This example has features styled using the unique symbology type where values of a particular attribute ("DISTRICT" in this example) have a specific style. We also supply a where parameter to keep the feature count to a minimum for this demo. Senior Citizens This example has features styled using the range symbology type where values of a particular attribute ("MED_AGE" in this example) within a specific range have a specific style.
Also, instead of a string-based popupTemplate, we're using a function that is passed feature attributes and returns a string for populating the Popup. San Francisco 311 Incidents This example makes use of the esriOptions parameter which, when used with an ArcGIS Server Feature Service, uses symbology and scaleRange options from ArcGIS Server. Winter Weather. Leaflet Vector Layers - Jason Sanford. What?
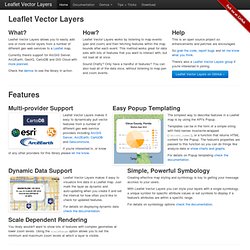
Leaflet Vector Layers allows you to easily add one or more vector layers from a number of different geo web services to a Leaflet map. Currently there's support for ArcGIS Server, Arc2Earth, GeoIQ, CartoDB and GIS Cloud with more planned. Check the demos to see the library in action. How? Leaflet Vector Layers works by listening to map events (pan and zoom) and then fetching features within the map bounds after each event. Sound Chatty? County Stats. Mbostock/us-atlas. Johan/world.geo.json. Leaflet-dvf. Joker-x/Leaflet.geoCSV. Examples: Leaflet Heatmap Layer.