
Learning How To Visualize Been getting a ton of requests for ‘how to’s and guides for creating decent visualizations and information designs. Made me think: maybe I could do some workshops in this area. I like developing ideas and working with people. Could be fun! So if you think you’d like to attend a workshop on visualization or organize one for your organisation, please fill in this quick form (30 seconds). In the meantime, you might be interested in a section I’ve been building in a far-flung corner of the site. The most recent one explores the stages we went through creating an infographic for Wired magazine about planets in other solar systems – or “exoplanets”. (Microscopic, dark and unimaginably far away, these tiny celestial objects should be impossible to spot. Here’s how we created it. Timelines: TimeTravel in TV and Film Yup, we went through 36 drafts of this. Versioning: Because Every Design Is Good For Something How do you flag and label 142 countries on a single map without choking the result?
22 free tools for data visualization and analysis You may not think you've got much in common with an investigative journalist or an academic medical researcher. But if you're trying to extract useful information from an ever-increasing inflow of data, you'll likely find visualization useful -- whether it's to show patterns or trends with graphics instead of mountains of text, or to try to explain complex issues to a nontechnical audience. There are many tools around to help turn data into graphics, but they can carry hefty price tags. The cost can make sense for professionals whose primary job is to find meaning in mountains of information, but you might not be able to justify such an expense if you or your users only need a graphics application from time to time, or if your budget for new tools is somewhat limited. If one of the higher-priced options is out of your reach, there are a surprising number of highly robust tools for data visualization and analysis that are available at no charge. Data cleaning DataWrangler
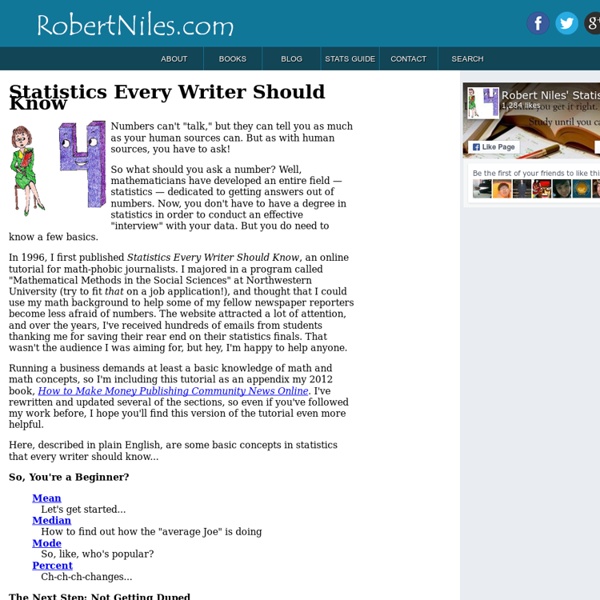
How to: get to grips with data journalism A graph showing the number of IEDs cleared from the Afghanistan War Logs Only a couple of years ago, the idea that journalists would need to know how to use a spreadsheet would have been laughed out of the newsroom. Now those benighted days are way behind us and extracting stories out of data is part of every journalist's toolkit of skills. Some people say the answer is to become a sort of super hacker, write code and immerse yourself in SQL. Of course, you could just ignore the whole thing, hope it'll go away and you can get back to longing to write colour pieces. 1) Sourcing the data This is a much undervalued skill - with many journalists simply outsourcing it to research departments and work experience students. But broadly, the general approach is to look for the most authoritative place for your data. GDP - from the Office for National Statistics. Carbon emissions from different countries - from the US Energy Information Agency. Adobe PDF files are the enemy of open data.
Data journalism training – some reflections I recently spent 2 days teaching the basics of data journalism to trainee journalists on a broadsheet newspaper. It’s a pretty intensive course that follows a path I’ve explored here previously – from finding data and interrogating it to visualizing it and mashing – and I wanted to record the results. My approach was both practical and conceptual. They need to know what semantic data is, what APIs are, the difference between a database and open data, and what is possible with all of the above. They need to know what design techniques make a visualisation clear, and the statistical quirks that need to be considered – or looked for. But they also need to be able to do it. The importance of editorial drive The first thing I ask them to do (after a broad introduction) is come up with a journalistic hypothesis they want to test (a process taken from Mark E Hunter’s excellent ebook Story Based Inquiry ). For the first time I have to use ’s spreadsheet software, which turns out to be not too bad.
How to be a data journalist | News Data journalism is huge. I don't mean 'huge' as in fashionable - although it has become that in recent months - but 'huge' as in 'incomprehensibly enormous'. It represents the convergence of a number of fields which are significant in their own right - from investigative research and statistics to design and programming. The idea of combining those skills to tell important stories is powerful - but also intimidating. Who can do all that? The reality is that almost no one is doing all of that, but there are enough different parts of the puzzle for people to easily get involved in, and go from there. 1. 'Finding data' can involve anything from having expert knowledge and contacts to being able to use computer assisted reporting skills or, for some, specific technical skills such as MySQL or Python to gather the data for you. 2. 3. 4. Tools such as ManyEyes for visualisation, and Yahoo! How to begin? So where does a budding data journalist start? Play around. And you know what?
datajournalismelab The inverted pyramid of data journalism I’ve been working for some time on picking apart the many processes which make up what we call data journalism. Indeed, if you read the chapter on data journalism (blogged draft) in my Online Journalism Handbook, or seen me speak on the subject, you’ll have seen my previous diagram that tries to explain those processes. I’ve now revised that considerably, and what I’ve come up with bears some explanation. I’ve cheekily called it the inverted pyramid of data journalism, partly because it begins with a large amount of information which becomes increasingly focused as you drill down into it until you reach the point of communicating the results. What’s more, I’ve also sketched out a second diagram that breaks down how data journalism stories are communicated – an area which I think has so far not been very widely explored. I’m hoping this will be helpful to those trying to get to grips with data, whether as journalists, developers or designers. UPDATE: Also in Spanish. Compile Clean Context
Infographic: Reading for the Future | Infographics on GOOD This content was produced by GOOD with the support of Apollo Group Being able to read is one of the most important skills a person can have, and a child's reading level in third grade gives a good indication of their future success. Why third grade? Take a look at the infographic to see how reading proficiency impacts a child's life, and what parents and teachers can do to ensure children are reading on grade level. Presented by Apollo Group, Teaching for Tomorrow explores education, innovation and technology in schools through original videos and infographics. Data-driven journalism Data-driven journalism, often shortened to "ddj", is a term in use since 2009/2010, to describe a journalistic process based on analyzing and filtering large data sets for the purpose of creating a news story. Main drivers for this process are newly available resources such as "open source" software and "open data". This approach to journalism builds on older practices, most notably on CAR (acronym for "computer-assisted reporting") a label used mainly in the US for decades. Data-driven journalism has an even wider approach. As projects like the MP Expense Scandal (2009) and the 2013 release of the "Offshore leaks" demonstrate, data-driven journalism can assume an investigative role, dealing with "not-so open" aka secret data on occasion. Definitions[edit] The data-driven journalism process. In 2013, Van Ess came with a shorter definition in [5] that doesn't involve visualisation per se: Reporting based on data[edit] Telling stories based on the data is the primary goal. Data quality[edit]
25 life-saving tips for Processing | Amnon P5 - Experiments with Processing by Amnon Owed 25 life-saving tips for Processing Posted by Amnon on January 28, 2012 · 37 Comments Well, perhaps they won’t literally save your life. But they surely will help you write your sketches easier, faster and more efficiently! This post will be covering tips, tricks and other need-to-know information about Processing. I’ve also included many runnable code examples. 1. frameCount, millis(), modulo % and noise Let me start with a few functions that in themselves and in combination are extremely useful. 2. math, logical and relational operator shortcuts Any program will use operators. 3. math with ints A very common mistake is doing math operations on integers and expecting a floating number outcome. 4. frameRate Processing’s frameRate is by default capped at 60 fps. 5. loading specific files from an external input directory Many applications use file input, for example an image or a data file. 9. combining 2D and 3D drawing What if you want a 2D background behind a 3D sketch? Final note!
Information Design – isabelmeirelles.com Course description:The course introduces basic concepts, methods and procedures of information design with focus on mapping information. It investigates visual systems and information structures such as maps, relational graphs, timelines and diagrams. Emphasis is placed on the exploration of conceptual and visual solutions, and on the creative process of organizing, visualizing and communicating information. Learning Objectives:• To develop basic critical language and procedures used in information design; • To learn how to analyze, organize, visualize and communicate information; • To explore methods of research, design and testing in the field of information design; • To explore how to communicate complex information to a specific audience. ASSIGNMENTS: For description and student work prior to 2009 please visit previous archive, which requires Flash player. Assignment #1 :Task: The assignment consists of weekly diagrams communicating facts. Laura Upham, 2010 Veronica Zhu, 2010
Jesse James Garrett: Visual Vocabulary for Information Architecture Looking for more? My book The Elements of User Experience puts information architecture and interaction design in context for beginners and experts alike. You can now order the book from Amazon.com. version 1.1b (6 March 2002) Jesse James Garrett (contact) Translations of this document are available: Chinese (thanks to Arky Tan) Japanese (thanks to Atsushi Hasegawa) Spanish (thanks to Javier Velasco) Italian (thanks to Laura Caprio and Beatrice Ghiglione) French (thanks to Francois Lamotte) German (thanks to Marcus Brinckhoff) Portuguese (thanks to Livia Labate and Laura Cretton Lessa) Table of Contents Summary Diagrams are an essential tool for communicating information architecture and interaction design in Web development teams. Version history 1.1b (6 Mar 2002) Information on built-in support in OmnGraffle 2.0 New shape library for iGrafx Flowcharter 1.1a (17 Sep 2001) New shape libraries for Macromedia FreeHand Posted cheat sheet and PDF shape template 1.1 (31 Jan 2001) 1.0 (17 Oct 2000)