
How Pop Chart Lab Made That Amazing Apple Infographic Robby Stein remembers when Kevin Systrom was just another startup guy, who’d created a photo sharing app called Instagram. They knew each other working at Google. Systrom’s idea for the thing was all around instant sharing—to capture fleeting moments, like a dog you met or going to the park. "People would comment, and then you’d have a conversation," recalls Stein. They had seemed like such an obvious thing to add. The solution was Instagram Stories, a way of quickly sharing videos and pictures that disappear after 24 hours. Different Space Means Different Rules Instagram revolves around the story feed—a stream of images and captions that users scroll past. Those rules, ultimately, flowed from the idea that Stories would have to have different incentives and feedback loops if it was going to nudge people into sharing things without overthinking them. What would happen if you were watching someone’s Story? What you don’t see in the Stories bar are thumbnails of what someone has posted.
20 Amazing iPad Apps for Educators When one looks at how technology has changed education over the past decade, one can’t help but be blown away by the sheer number of iPad apps for educators that have absolutely flooded the electronic marketplace. There are so many iPad apps for teachers released every month that even the most plugged-in educator would have a difficult time processing and utilizing them all. Luckily, when teachers are looking to learn how to use iPads in the classroom, they need to look no further than TeachHUB magazine and TeachHUB.com -- an educator’s primary go-to resource when researching iPad apps for teachers and iPads in the classroom. Read on to learn about TeachHUB magazine and TeachHUB.com’s updated list of the hottest iPad apps for teachers and iPad apps for education, destined to forever alter your curriculum landscape, organized here by subject. Scroll down for an index of many of TeachHUB's helpful iPads in the classroom app reviews and more of the best usage of iPads in the classroom. Trello
Un quatrième gratte-ciel proche du Centre Bell annoncé lundi | Maxime Bergeron Après des mois de spéculation, le groupe immobilier Cadillac Fairview (CF) et ses partenaires lanceront finalement la tour Avenue des Canadiens lundi prochain. Cet immeuble de copropriétés d'une quarantaine d'étages sera le quatrième annoncé dans les environs immédiats du Centre Bell en l'espace de quelques mois. > Sur le blogue de Maxime Bergeron: Une nouvelle tour 100% bureau, finalement La semaine dernière, le groupe Broccolini a lancé L'avenue, un gratte-ciel résidentiel de 50 étages qui sera situé à quelques dizaines de mètres du projet de CF.
Making Sense of the Data This post is an adaptation of my presentation at the 2011 HOW Interactive Design Conference in San Francisco. I included a variety of slide transitions in my talk, so in some cases below, I’ve consolidated slide groups into animated GIFs. Keep your eye out for those so you don’t miss any details. Do you remember your last yearly physical? After the exam, my doctor and I had the following exchange: Me: Should I go ahead and schedule next year’s appointment? Stuff. Stuff? A few days later, I got the results of my blood work in the mail. And that, right there, is the connection I want to make with measurement. Here’s an example for you to see; a page from an actual KPI that one of my clients paid for a few years ago: Ugh. I thought it was so important that you see this that I was willing to contaminate this beautiful page by including it. I like smart people. “Where’s my KPI report? you’ve got a ready response: “Oh, you mean the…” Actually, maybe don’t say that. Dysfunctional Measurement 1. 2. 3.
50 Must-Have Educational Apps It’s time for holiday road trips and you know what that means: driving, flying, cranky kids, and… teaching opportunities! What’s that, you say? Well, there is so much downtime during the holidays where kids and adults spend hours just passing the time… why not try out some new apps on your phone? Many of these apps were found by The Teaching Palette, be sure to check out their fantastic site for more helpful resources! From learning the ABCs to doodling, there’s plenty of terrific apps out there that will pass the time but also educate. *Most of the links below are to the iTunes store which will open another window and/or iTunes. Great Apps For Kids (And Adults) Alphabet Animals Perfect for your talented toddler, this game is packed with colorful animations, animal sounds, and tons of tips for learning their letters. WordSearch Kids Kids search and highlight vocabulary words by tapping the first and last letters. Mad Libs Just as goofy and fun as your remember. SmackTalk Annoying?
Neri Oxman: On Designing Form Neri Oxman is an architect and founder of MATERIALECOLOGY with the MIT Media Lab. Her work focuses on computational strategies for form finding; she chooses to define and design processes that generate form. She has published numerous papers and has contributed to various texts. Her work has also been featured at the MOMA for the exhibit “Design and the Elastic Mind“, which she designed four systems of processes. In this lecture posted by PopTech, Oxman discusses what the processes of nature can teach designers and how computational strategies defined by materials and the environment can expand the possibilities of the generation of form through algorithms and analysis. Follow us after the break for more. Emergence can be defined by a spontaneous order, a self-organization, that appears in nature and natural processes. Oxman’s work is inspired by the quest for the origin of form and form finders of the 1970s that were led by material and environmental properties.
Easel.ly Debutes Online Editor of Infographics San Diego-based start-up Easel.ly [easel.ly] is offering a beta service that allows lay people to design and implement their own "infographics" via an online editor. The user-based customization of infographics seems to be the next phase after the automatic generation of infographics, and has already been promised by community websites like visual.ly. For now, easel.ly allows users to drag and drop predefined and uploaded vector images on pre-designed canvases and themes for easy creation and customization of infographics. According to the founders Patrick Alcoke and Neil Harris, all themes have been designed by graphic designers to ensure the highest quality for their users to start with. The service is currently still in beta and thus free.
Herramientas para hacer mapas mentales en línea Los mapas mentales son una gran ayuda para plasmar una idea de manera concreta y poder entenderla mas fácilmente. Su uso se extiende desde el ámbito educativo hasta el nivel empresarial donde puede constituir un gran elemento para presentar ideas en reuniones, entonces por qué no aprovecharlos al máximo y utilizarlos con mayor frecuencia. En el blog ya habíamos compartido una gran selección de software de escritorio para elaborar mapas conceptuales y mentales, pero que pasa si no queremos instalar nada en el computador o si nos encontramos en uno prestado, lo mas conveniente es contar con una aplicación web que pueda ayudarnos. A continuación les comparto una interesante selección de herramientas gratuitas para elaborar mapas mentales en línea hecha por Wwwhatsnew y que he querido publicar aquí para ustedes. 1. 2. 3. 4. 5. 6. 7.
Lessons From The Past: How Living Like Great Grandma Is Green © Matt's backyard circa 1913. Gardens, root cellar, chicken coop, dog house, well, cistern, and outhouse all worked within the patterns of nature. Steve Mouzon has noted that everyone used to be green: Originally, before the Thermostat Age, the places we built had no choice but to be green, otherwise people would freeze to death in the winter, die of heat strokes by summer, or other really bad things would happen to them. At the Old House Web, Matt Grocoff writes a wonderful piece about how people lived in the house he is in now, before the Thermostat Age. A photograph of our backyard, taken circa 1913, documents several ways in which the Gauss family lived within their means in an elegant cradle-to-cradle, closed loop pattern. They didn't have indoor plumbing, but "of course there was the lovely outdoor compostable toilet, also known as the outhouse." But the fact of the matter is, these lessons from the past can be templates for the future.
lunis suppe Advertise here via BSA In this article, we’ll get rolling on developing plug-in free by creating bar graphs and similar graphics, using NASDAQ’s current web site as an example. But we won’t be creating merely a picture of a bar graph, but a real, interactive bar graph. Let’s take a look at an existing site that uses Flash, then build one using HTML5. If you have Flash installed, you’ll see a fancy line chart. If you don’t have Flash installed, then the site just shows you a graphic image. Now, we’ll build something similar. The General Layout In general, when you develop web sites, you often want to break up your code files. The first line is important and required; the doctype tells the browser which version of HTML to use. Gathering the Data At the heart of any good software program is the data. Just before the closing </body> tag, insert an open <script> and closing </script> tag along with the following code as shown inside the script tags. Now let’s move onto the user interface.
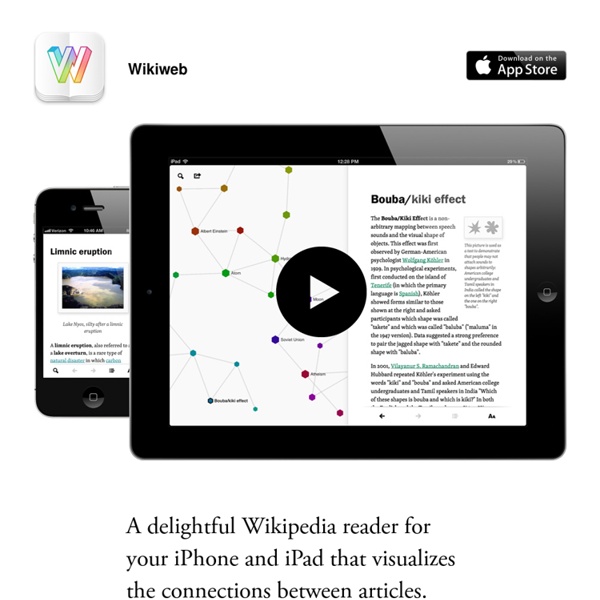
Une app qui montre les liens entre tous les articles de wikipedia. Leur film promo est intéressant (digital library vs IRL library) by amsika Jul 10