
10 Steps To Designing An Amazing Infographic Information can be useful—and even beautiful—but only when it’s presented well. In an age of information overload, any guidance through the clutter comes as a welcome relief. That’s one reason for the recent popularity of information graphics. Infographics are visual designs that help to explain complicated data in a simple way (mental-health emergencies at Burning Man, anyone?). But how are they created? What can we learn from the designer’s process? Over the last decade, Hyperakt has come to specialize in this type of design, and we’ve found a process that works for us. 1. Sifting through data is where it all begins. 2. While it’s tempting to read only the highlighted facts and skim the rest, this shortcut tends to result in more time wasted later. 3. What starts as boring data will become a boring infographic unless a great story can be found. 4. As a story emerges from the data at hand, it’s time to stop for a reality check. The truth in information takes experience to uncover. 5.
The Anatomy Of An Infographic: 5 Steps To Create A Powerful Visual Information is very powerful but for the most bit it is bland and unimaginative. Infographics channel information in a visually pleasing, instantly understandable manner, making it not only powerful, but extremely beautiful. Once used predominantly to make maps more approachable, scientific charts less daunting and as key learning tools for children, inforgraphics have now permeated all aspects of the modern world. I designed a couple of infographics back in college, the need arising especially around the time Soccer World Cup fever spiked. Infographics can appear daunting to some with the sheer amount of data they present, but designed in the right manner and step by step, they can actually be one of the most fun things you will ever create. Today I am going to walk you through the anatomy of an infographic, its different levels and sub-levels and a 5-step process to ensure that your infographic is not only conceptually sound, but accurate and easily understood. Anatomy Of An Infographic
5 Mind-Bending Facts About Dreams | Lucid Dreams & Nightmares When your head hits the pillow, for many it's lights out for the conscious part of you. But the cells firing in your brain are very much awake, sparking enough energy to produce the sometimes vivid and sometimes downright haunted dreams that take place during the rapid-eye-movement stage of your sleep. Why do some people have nightmares while others really spend their nights in bliss? Here's some of what we know about what goes on in dreamland. 1. As if nightmares weren't bad enough, a rare sleep disorder — called REM sleep behavior disorder — causes people to act out their dreams, sometimes with violent thrashes, kicks and screams. 2. Staying up late has its perks, but whimsical dreaming is not one of them. In the study 264 university students rated how often they experienced nightmares on a scale from 0 to 4, never to always, respectively. 3. As in their wake hours, men also dream about sex more than women do. 4. 5.
10 Technology Skills Every Educator Should Have This past January I wrote "10 Tech Skills Every Student Should Have" and I have decided to modify it for the "10 Tech Skills Every Educator Should Have". Here's my list. Overall, educators need to understand some basics about technology and that it is not a be-all-end-all solution to everything in a classroom. Technology can help teachers differentiate and provide new experiences for their students. Technology can also help students better understand a concept and provide extra help for them. The How's, Why's and Value of Educational Technology 1. UPDATED thanks to a great comment below.2. 3. 4. 5. UPDATED thanks to a great comment below.6. 7. 8. 9. 10. Bonus: 11. What do you think are the top tech skills educators need to know? Related: My Favorite Resources for Students and Educators Differentiating with Web 2.0 Technologies Technology I use Everyday as an Educator Unfettered by Stuff - or "Why I don't lug stuff home every night"Google for Educators Evernote for Educators
40 Useful and Creative Infographics Six Revisions Menu Main Categories CSS HTML JavaScript Web Design WordPress Web Development Design Inspiration UX Design UI Design Freebies Tutorials Tools Links About Contact Advertise RSS Twitter Facebook 40 Useful and Creative Infographics By Jacob Gube Information graphics (or infographics) are graphical depictions of data and information. In this collection, you’ll find forty beautiful and educational infographics, displaying the uncommon spectacle of "art meets science". 1. The proportion of ingredients for popular coffee drinks and their pronunciation keys. 2. This infographic showcases the history of the Swine Flu, starting from 1976. 3. 4. 5. The top breweries and beers in the U.S. 6. 7. 389 Years Ago A rundown of the historic events in African-American culture. 8. 9. 10. 11. An illustrated guide at how the Global Warming phenomenon works. 13. A packed visual piece on tobacco chemicals and tobacco trade worldwide. 14. 15. 16. A graphical representation of consumer spending across the globe. 17.
InfoGraphic Designs: Overview, Examples and Best Practices Information graphics or infographics are visual representations of information, data or knowledge. These graphics are used where complex information needs to be explained quickly and clearly, such as in signs, maps, journalism, technical writing, and education. They are also used extensively as tools by computer scientists, mathematicians, and statisticians to ease the process of developing and communicating conceptual information. They can present a rich amount of information without intimidating you. Or sometimes they intimidate you, but make the digesting of the information much more bearable. You may be interested in the following related articles as well. Feel free to join us and you are always welcome to share your thoughts that our readers may find helpful. Don’t forget to and follow us on Twitter — for recent updates. What is InfoGraphics? Little History of InfoGraphics! In prehistory, early humans created the first information graphics: cave paintings, later maps and now charts.
Top 10 Amazing Facts About Dreams Facts This afternoon I had a (very rare) nap. During that nap I had a lucid dream (most of which I no longer remember). As I was waking up, I was thinking about my dream and thought that it would be a great idea to write a list about dreams for the site. So, here are the top 10 amazing facts about dreams. 10. People who become blind after birth can see images in their dreams. 9. Within 5 minutes of waking, half of your dream if forgotten. In Xanadu did Kubla Khan A stately pleasure-dome decree: Where Alph, the sacred river, ran Through caverns measureless to man Down to a sunless sea. [...] Curiously, Robert Louis Stevenson came up with the story of Doctor Jeckyll and Mr. 8. Every human being dreams (except in cases of extreme psychological disorder) but men and women have different dreams and different physical reactions. 7. 6. 5. A full 12% of sighted people dream exclusively in black and white. 4. If you dream about some particular subject it is not often that the dream is about that.
What is a 21st century teacher? People toss around terms in education and attach the words “21st century” to appear cutting edge or on the front end of trending ideas. As a teacher in the 21st century, I find it amazing to see some of the things that are so-called 21st century and yet are no different from ideas from the 20th or even the 19th century. With that in mind, I reflected on what it takes to be a teacher in the 21st century and what such a teacher looks like. Obviously, a 21st-century teacher should be tall, handsome and have a sweet spot for superheroes. Beyond that, I think there are some key characteristics that good 21st-century teachers need. Be a connected educator. Be a master of technology. Interactive whiteboards are being used as chalkboards once were, computers are being used to make flash cards and tablets are being used to do word searches. Be a reflective practitioner. Be an advocate. None of these ideas is radical or groundbreaking.
15 New Extremely Creative Infographics With the help of evolution and progress, people’s lives become easier day by day. Today everything is simpler than it used to be in the past. Let’s take information for example. Infographics are graphic visual representations of data and information and it is the best way to visualize an idea or a thought. But don’t be discouraged – with some practice and yet some practice again, anyone willing to achieve something will definitely achieve it. Magnolia – Infographics & Data Visualization Elements Pack How Would You Like Your Graphic Design? Infographic Facts about Struggling Countries around the World Is it good to be single? The history of Apple’s iPod An infographic Identity Theft Facts and Figures Holiday Shopping Infographic Facebook vs Twitter Infographic Cloud Computing Stats Infographic Breakdown of the Blogosphere The (Visual) Evolution of the Batmobile The Seven Types of Iphone Owners Infographic The Biggest Shift Infographics Twitter Territory The History of Online Video
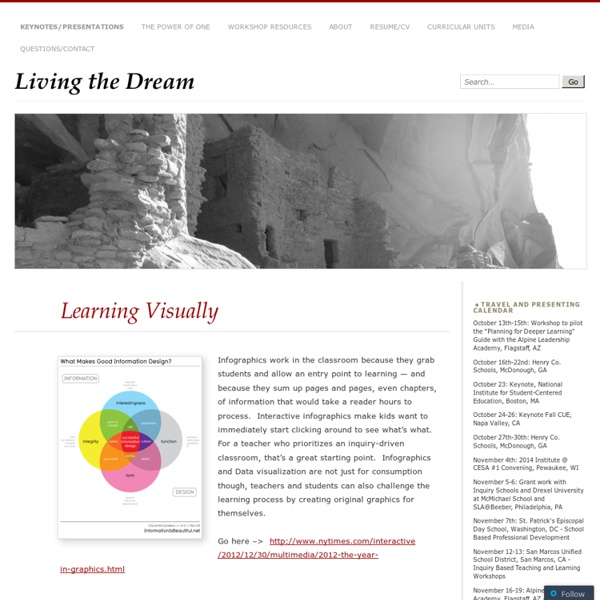
10 Awesome Free Tools To Make Infographics Advertisement Who can resist a colourful, thoughtful venn diagram anyway? In terms of blogging success, infographics are far more likely to be shared than your average blog post. This means more eyeballs on your important information, more people rallying for your cause, more backlinks and more visits to your blog. Designing An Infographic Some great tips for designing infographics: Keep it simple! Ideas for infographic formats include: Timelines;Flow charts;Annotated maps;Graphs;Venn diagrams;Size comparisons;Showing familiar objects or similar size or value. Here are some great tutorials on infographic creation: Creating Your Infographic Plan and research.If required, use free software to create simple graphs and visualisations of data.Use vector graphic software to bring these visualisations into the one graphic. Ultimately, if you have a little design skill, the very best approach is to create all the simple graphs and illustrations yourself using vector graphic software. Stat Planet Hohli