Human rights & democracy statistics
About this Video In this video, made for the Oslo freedom Forum 2009, Hans Rosling discuss the difficulty in measuring progress in Human Rights in the form of comparable numerical statistics. He also shows the surprisingly weak correlation between existing estimates for democracy and socio-economic progress.
Create Something.
Donate Login Remember Me Create An Account
perthwiki - home
The Joy of Stats
About the video Hans Rosling says there’s nothing boring about stats, and then goes on to prove it. A one-hour long documentary produced by Wingspan Productions and broadcast by BBC, 2010. A DVD is available to order from Wingspan Productions.
Free Online Graph Paper
Downloadable and very printable, I find these PDFs extremely useful. Graph Paper Quick Picks Now set to: 8 1/2 x 11 Paper. Ruled in Inches. Now set to: A4 Paper, Ruled in Millimeters. Custom Graph Papers
Desktop
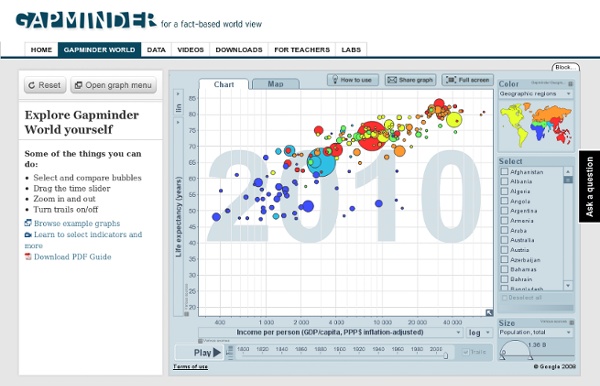
This software has been renamed to Gapminder World Offline Because of technical problems the software on this page is no longer being maintained! Please visit Gapminder World Offline (Beta) instead.
Detexify LaTeX handwritten symbol recognition
Want a Mac app? Lucky you. The Mac app is finally stable enough. See how it works on Vimeo.
Sciweavers