
Map Explorer Explore maps of future climate as simulated by individual climate models. IMPORTANT: When viewing and using results from individual climate models, it is imperative that you also take account of the range in the climate projections. If you have not already done so, we encourage you to use the Climate Futures approach to identify two or three models that capture the range of results relevant to your application. 'Carmageddon': 50-lane traffic jam in China causes chaos The 50-lane traffic jam was dubbed "carmageddon". Photo: Reuters And you thought your post-holiday commute was bad. Thousands of Chinese holidaymakers, returning home from a week-long break, have found themselves stuck in a seemingly endless traffic jam - spanning the entire width of a 50-lane expressway. The snarl-up's been dubbed "Carmageddon".
Origin of crops by Colin K. Khoury, Harold A. Achicanoy, Carlos Navarro-Racines, Steven Sotelo, and Andy Jarvis at the International Center for Tropical Agriculture (CIAT). India heatwave kills 1000 as roads melt Could not load plugins: File not found Hundreds dead from Indian heat wave More than 500 people have died in India as a stifling heat wave saw temperatures rise above 47 degrees Celsius Hyderabad: More than 1000 people are now believed to have died in a major heatwave across India, that has seen roads melt in New Delhi and temperatures near 50 degrees. With no end in sight to the searing conditions, and officials warning the scorching temperatures would continue for several more days, hospitals are on alert to treat victims of heatstroke and authorities are advising people to stay indoors. In the worst-hit state of Andhra Pradesh, in the south, 551 people have died in the past seven days as temperatures hit 47 degrees on Monday.
Aurora Australis Viewing Locations ( southern hemisphere ) ABOUTA collated map of aurora australis viewing locations in Australia & New Zealand.The map was established and is overseen by the admins of Facebook group Aurora Australis Tasmania.FYI: In the southern hemisphere we face South to view aurora australis ........( in the northern hemisphere you face North to view aurora borealis ) ==================== DATA LICENSING ====================Please do not collect / disseminate our map location information Please ask for permission if you wish to re-use our informationAs per respective entities======================================================= DISCLAIMER & SAFETY NOTICE:> Care taken but no responsibility is given for the accuracy of the map - locations have been supplied by members of Aurora Australis Tasmania &/or Aurora Australis (New Zealand) facebook groups, who are contributing the location to be suitable for viewing an aurora australis from. !!
India heatwave kills nearly 300 people Could not load plugins: File not found Indian zoo gets cooling To combat soaring temperatures zoo authorities in India's western Gujarat state are cooling the inmates with water. New Delhi: India's Meteorological Department has sounded a red alert for several states as the death toll from a severe heatwave climbed to 289. The department said heatwave conditions would continue for another three days in many parts of northern India, including the national capital New Delhi, and the southern states of Andhra Pradesh and Telangana.
Map of ‘vegetarian friendliness’ (number of vegetarian restaurants) in Europe by country Tip: See my list of the Most Common Mistakes in English. It will teach you how to avoid mistakes with commas, prepositions, irregular verbs, and much more (PDF Version). The original idea of this article was to create a map showing the percentage of population following a vegetarian diet, but it turned out to be impossible to find a reliable source of data for more than a handful of countries. Since there is correlation between supply and demand, I decided to create a map of the supply part instead (which, however, is affected by many other factors than just the percentage of vegetarians, e.g. tourism and overall wealth). The following map is based on the number on entries at HappyCow, the largest directory of vegetarian restaurants in the world, and shows the number of vegetarian restaurants per 1 million inhabitants.
Sydney heatwave: city uses more water in a day than any time in past 14 years Sydney residents have soaked up more water in one day than they have on any other day in more than a decade after enduring sweltering conditions. With temperatures hovering around 35C in the city and 40C in the west, demand for water on Sunday topped the peak of the past 14 years at 2.215bn litres – about 8.8bn glasses of water. It exceeded highest daily usage since 29 January 2003, when there was a demand for 2.273bn litres. The 54.5bn litres soaked up in total this January – an average of 1.76bn litres a day – was also 24% higher than in the same month last year, according to Sydney Water.
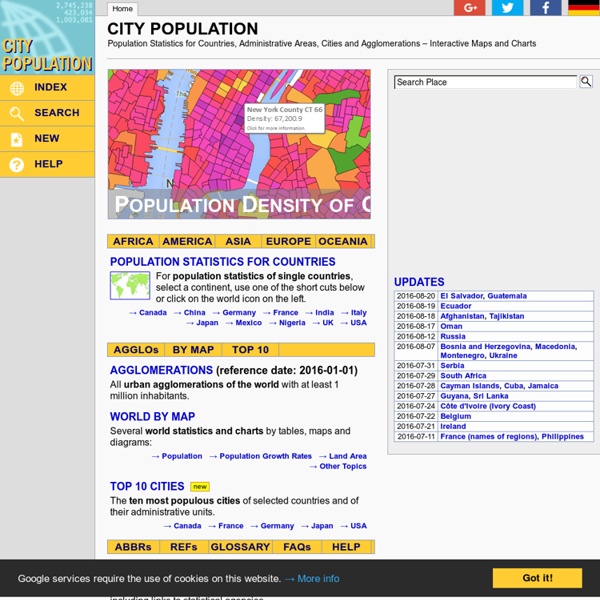
Population growth & regional internal migration in your area 2013-2014 Melbourne is expected to overtake Sydney as Australia’s largest city by 2056, as parts of Australia face higher growth rates than others. The average population growth rate across Australia is 1.6 per cent, data from the Australian Bureau of Statistics shows. However, the populations of some districts are shrinking while others have growth rates more than 10 per cent. The suburb of Truganina, part of Greater Melbourne, saw a 16.8 per cent population growth in 2013-14. The district of Anglesea, 90km away, saw its population decline 3.3 per cent. This map shows regional estimates of population growth for 2013-2014. Pant by numbers: the cities with the most dangerous air – listed Billions of people in cities around the world are exposed to dangerous air, but pollution levels vary widely – and the fast-growing cities of Asia and Africa are the worst affected. We’ve broken down data from the World Health Organization on ultra-fine particles of less than 2.5 microns (PM2.5s) region by region. Paris’s air may have almost twice as many PM2.5s as WHO recommended levels (18 micrograms per cubic metre compared with 10µg/m³) – but Delhi’s air contains 122µg/m³, while Zabol, Iran, is the worst at 217µg/m³. Tetovo in Macedonia – a city of 50,000 near the Kosovo border – has the worst PM2.5 air pollution in Europe, according to the WHO data. Once Turkey is included, that country claims eight of the top 10 spots in the most polluted European cities. The most polluted cities in the US and Canada are dominated by California.
OpenStreetMap Where am I? Welcome to OpenStreetMap! OpenStreetMap is a map of the world, created by people like you and free to use under an open license. Mumbai: Portion of skywalk collapses, one injured By: PTI | Mumbai | Published:February 8, 2017 9:40 am A senior citizen was seriously injured after a portion of a skywalk in suburban Dahisar collapsed, civic officials said Wedneday. Sunil Kulkarni (65) received serious injuries in the collapse last night at Dahisar West. Bystanders immediately rushed him to nearby Silverline hospital where he is being treated, said an official from BMC Disaster Management Control Room. According to the official, there were no other casualties in the incident.
International Development - NGIS This project trained 195 people from 95 organisations to enhance the capacity of Tonga, Papua New Guinea, Vanuatu and Samoa to undertake assessments of inundation exposure to key settlements and infrastructure at risk from sea level rise through the provision of critical baseline data, improved GIS capacity, and implementation of coastal inundation modelling. The software and online spatial tools delivered as part of this project enabled maps to be printed and laminated for presentations to local communities. These flood maps provided an important mechanism for informing communities of their potential risk.
City living, stress and mental health - NHSUK People who live in the country are happier, according to the Daily Mail. The article said: “city dwellers think differently from people who live in the country – and are more likely to suffer mental illness as a result.” The news is based on German research that compared patterns of brain activity seen in response to social stress in urban and rural dwellers.