Technology readiness level
NASA Technology Readiness Levels Technology readiness levels (TRLs) are measures used to assess the maturity of evolving technologies (devices, materials, components, software, work processes, etc.) during its development and in some cases during early operations. Generally speaking, when a new technology is first invented or conceptualized, it is not suitable for immediate application. Instead, new technologies are usually subjected to experimentation, refinement, and increasingly realistic testing. Definitions[edit] Different definitions are used. U.S. Related DoD definitions[edit] The DoD uses similar definitions for the following specialized areas: Software Technology Readiness Levels[2]Biomedical Technology Readiness LevelsManufacturing Readiness Level NASA definitions[edit] ESA definition[edit] Instruments and spacecraft sub-systems are classified according to a "Technology Readiness level" (TRL) on a scale of 1 to 9. Oil and gas industry[edit] TRL 1 Concept demonstrated. See also[edit]
Cheap shots at the Gartner Hype Curve | Catenary
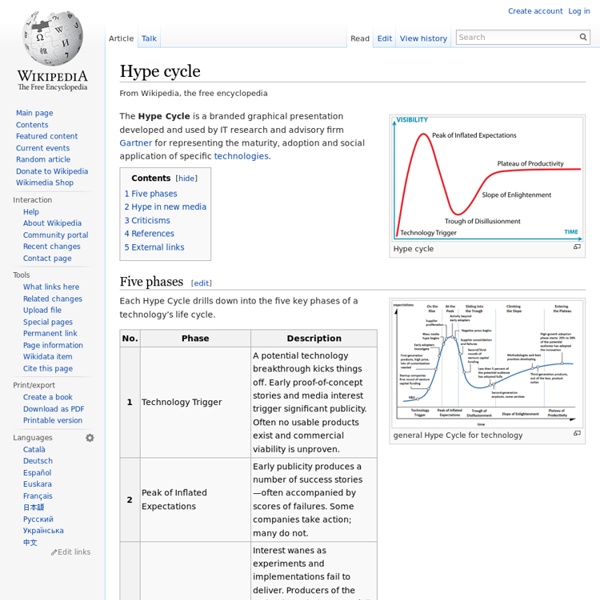
The Gartner Hype curve, or Hype cycle, summarizes the visibility and the maturity of currently hot technologies and forecasts the productivity they will have. At both of the workshops in CASCON that I went to, presenters showed us the most current curve, pointing out that web 2.0 is currently at the “peak of inflated expectations”. They claim we should expect it to descend to the “trough of disillusionment”, only to see it triumph in its recovery through the “slope of enlightenment” and, ultimately, the “plateau of productivity” (click on the image for a better view). Apparently, this curve is the distillation of thousands of hours of work of expert forecasters and technologists. Irrational optimism: The curve tells you that, no matter how wacky your technology is, and how unachievable its goals, after it fails to live up to its hype things are gonna get better, always! The Aranda Ignominy Curve Like this: Like Loading...
Google Analytics --> Infographics
Creating your own fancy infographics is not always easy, especially if you don’t know a whole lot about design. Thanks to Visual.ly’s new tool for Google Analytics, you won’t have to do a whole lot to turn your Google Analytics data into an infographic. Just sign in on the site, and you are set. Log on to Visual.ly to start creating infographics using your Google Analytics data. Another great service by these folks. Submit your own infographics People who visited this article also visited:
Mobile Marketing Psychology | Larry Rondeau
Mobile as a marketing channel is definitely on the move. A Pew Research study reported that 56% of U.S. adults now own smartphones. Smartphone usage is highest among younger, better educated and more highly paid Americans. They represent the very consumers often targeted by retailers, insurance carriers and financial services providers. It’s important for mobile marketers to get it right the first time. How can mobile marketers get it right the first time? A key factor is having people with the right knowledge base working on mobile e-commerce sites and advertising. Setting the right mood Clearly, goal and reward seeking is a major motivator for anyone using a smartphone in shopping. Mobile websites that facilitate this accomplish an important objective. Innocent associations – like Pavlov’s dogs salivating at the sound of a bell that was often rung when they were fed – attach good or bad feelings to something that was merely present when the feelings occurred. Calming fear of loss
The Digital Universe 2013 - New Zealand
Unlocking the Future of Work: Don’t Let the Future Happen to You
Les attentes des consommateurs Francais en 2012